The graph explorer
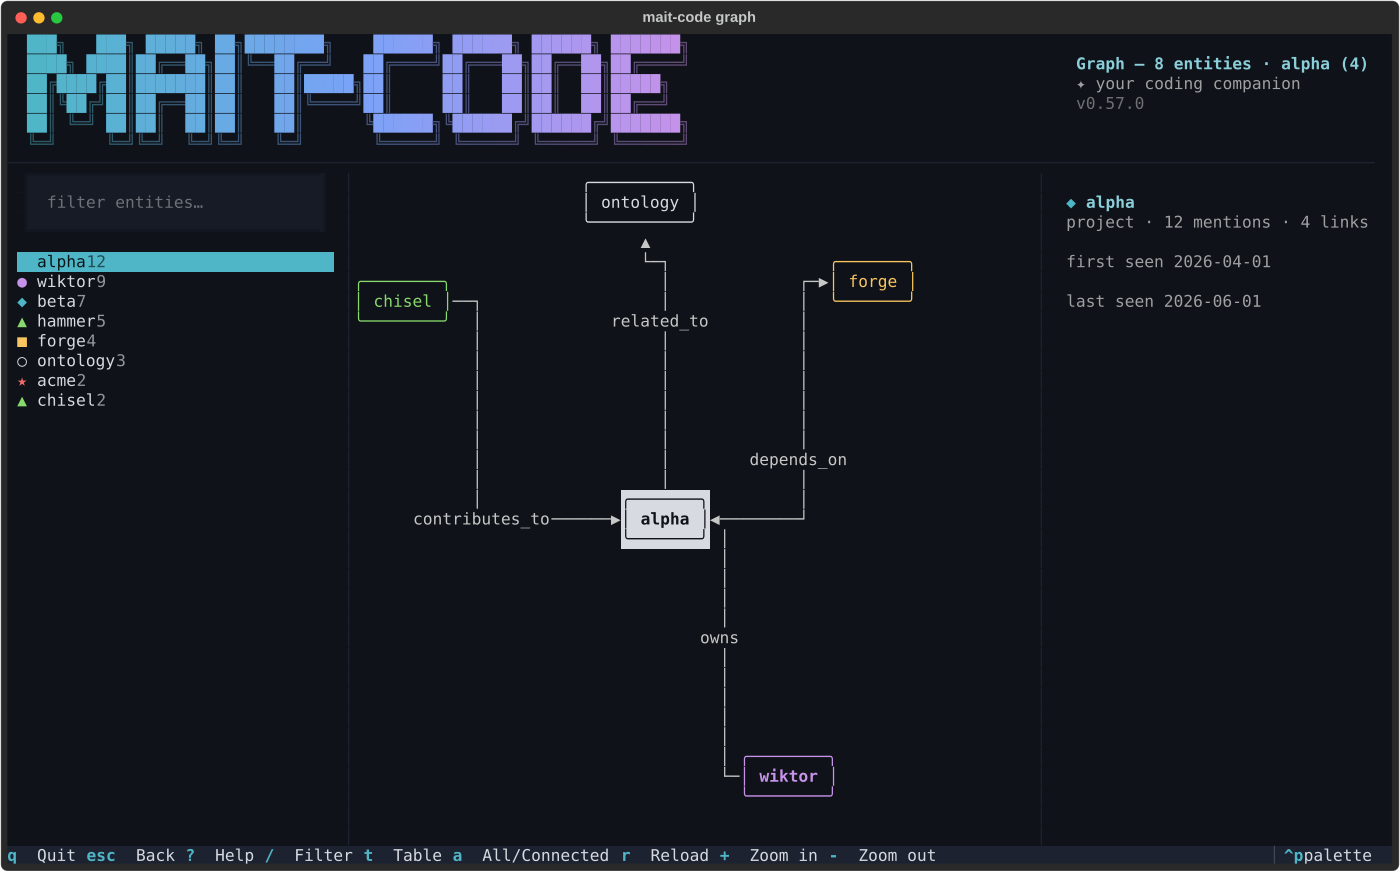
mait-code graph is a full-screen, read-only window onto the knowledge
graph — the entities and relationships the observe hook quietly accumulates
alongside your memories. Where the memory browser shows
what the companion remembers, this shows what it has connected: pick an
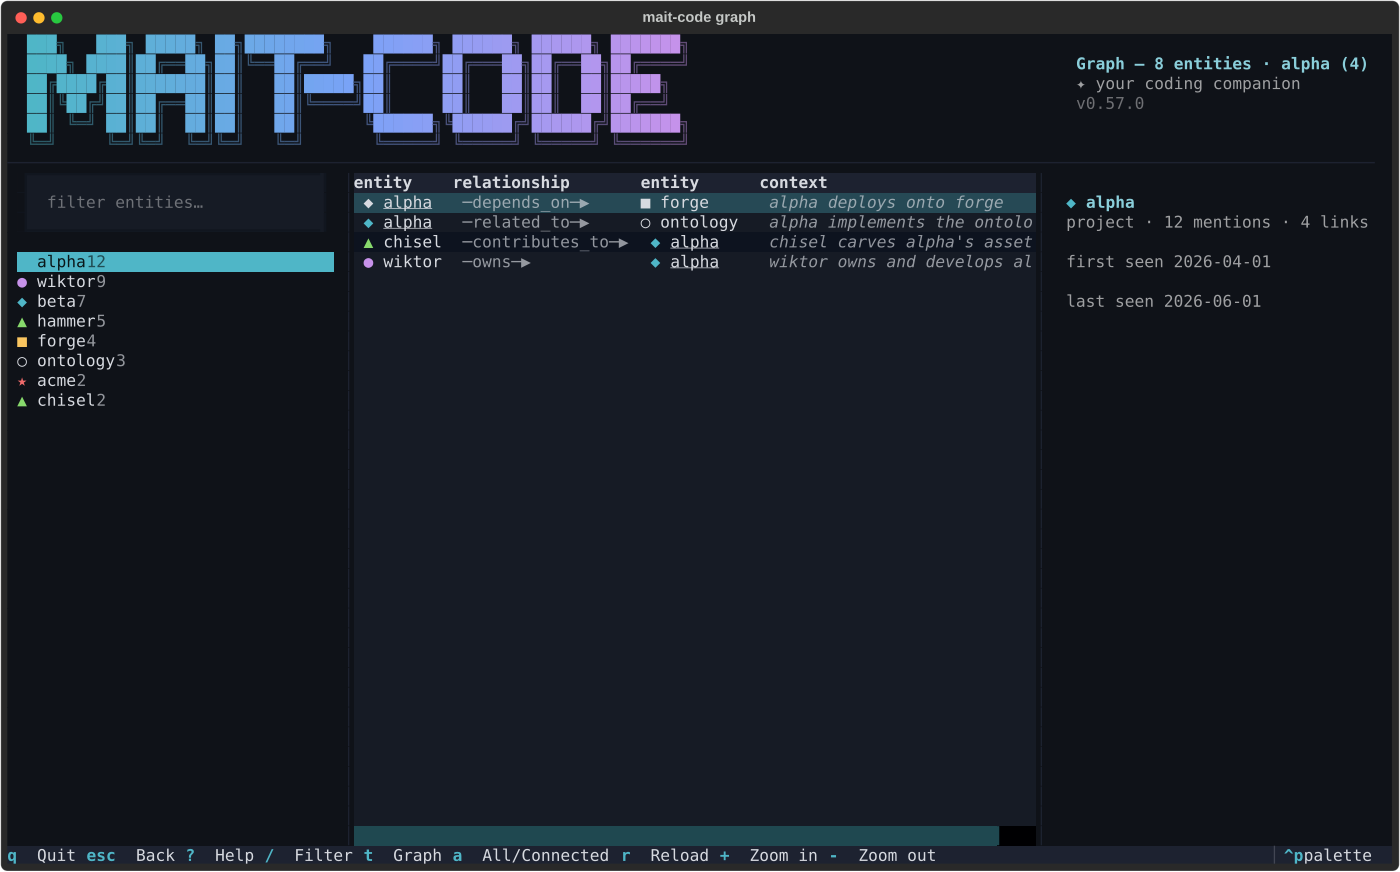
entity and see its immediate neighbourhood, either as a node-link diagram or
as a flat relationship table, with every edge's free-text context a glance
away.
Why it exists
Every session, the observe hook extracts entities (people, projects, tools,
services, concepts, organisations) and typed relationships between them into
memory.db. The text verbs — mc-tool-memory entities and relationships —
could already list them, but lists hide the one thing a graph is for: shape.
That your projects share infrastructure, that one tool sits under half your
stack, that a person connects two clusters. The explorer makes the
neighbourhood visible, and surfaces the relationship context sentences —
the richest field the graph holds, which nothing else displays.
It is deliberately ego-centric: you always look at one entity's 1-hop neighbourhood, never the whole graph at once. The topology decides this — the graph is hub-and-spoke with a long noise tail, so a whole-graph view would be an unreadable hairball while any single neighbourhood renders cleanly.
The layout
- The masthead — the shared brand banner, labelled Graph, with the entity count, the current centre and its link count, and the filter state folded into the subtitle.
- The body — a filter box over the entity list on the left (ordered by mention count, each row glyph-typed), the neighbourhood in the centre (the widest share), and the detail pane on the right.
- The footer — the live key hints.
Each entity type has a glyph and a theme colour: ● person, ◆ project,
▲ tool, ■ service, ○ concept, ★ org, · unknown. The colours follow
the active theme, so the graph re-skins with Ctrl+P like every other
mait-code TUI.
Two views of a neighbourhood
The centre pane has two interchangeable renderings — t swaps them:
- The graph view draws the neighbourhood as a node-link diagram (via
netext): boxes coloured by entity
type, the centre entity inverted, arrows showing direction. Edge labels
appear only on small neighbourhoods (≤15 nodes) — the renderer draws them
with no collision avoidance, so at hub density they would overdraw each
other.
+/-zoom; the view starts auto-fitted. - The table view lists one relationship per row: glyph-typed entities,
a directional
─type─▶column, and the context line (clipped — the detail pane has it in full). At hub density this reads better than any diagram, and it is the only view that shows every edge when two entities are connected by more than one relationship type (the diagram draws one line per pair).
Walking the graph
Navigation is the same in both views:
- Scroll the entity list and the explorer follows: the detail pane previews each entity at once, and the neighbourhood re-centres when the cursor rests for a beat (hub layouts are too heavy to redraw on every arrow press). Enter re-centres immediately.
- In the graph view, click any node to re-centre on it; click an edge to read its context in the detail pane.
- In the table view, moving the cursor previews each relationship's context; Enter on a row walks to the entity at its other end.
The detail pane always shows the selection: an entity's type, mention count, link count and seen window — or a relationship's endpoints, seen window, and its full context text.
The noise filter
Most of the graph's entities are single-mention dust — session ephemera the
extractor noticed once and never again. By default the entity list hides
anything with fewer than two mentions or no relationships; a toggles
the full, unfiltered list when you need to find something faint. Nothing is
ever deleted by the explorer — the filter is a view, not a cleanup. (For
actual cleanup, mc-tool-memory entities merge folds duplicate entities
together — see How memory works.)
Keys
| Key | Action |
|---|---|
/ |
Focus the filter |
t |
Swap graph ⇄ table |
a |
Toggle the noise filter (all ⇄ connected) |
+ (or =) / - |
Zoom the graph view |
r |
Reload from the database |
1 / 2 / 3 |
Focus list / centre / detail |
Ctrl+P |
Command palette (incl. theme switching) |
? |
Key cheat-sheet |
Esc |
Back to the list; from the list, quit |
q |
Quit |
Non-TTY fallback
Like the other TUIs, mait-code graph only opens the explorer on a TTY.
Piped or in CI it prints the graph's hubs instead — the connected entities
with their types, mention counts and link counts — so the command always
answers something.
See also
- How memory works — how entities and relationships are extracted, and the canonical type vocabularies.
- The memory browser — the entries the graph is derived from.
- The review queue — keeping the curated tier fresh.