The home hub
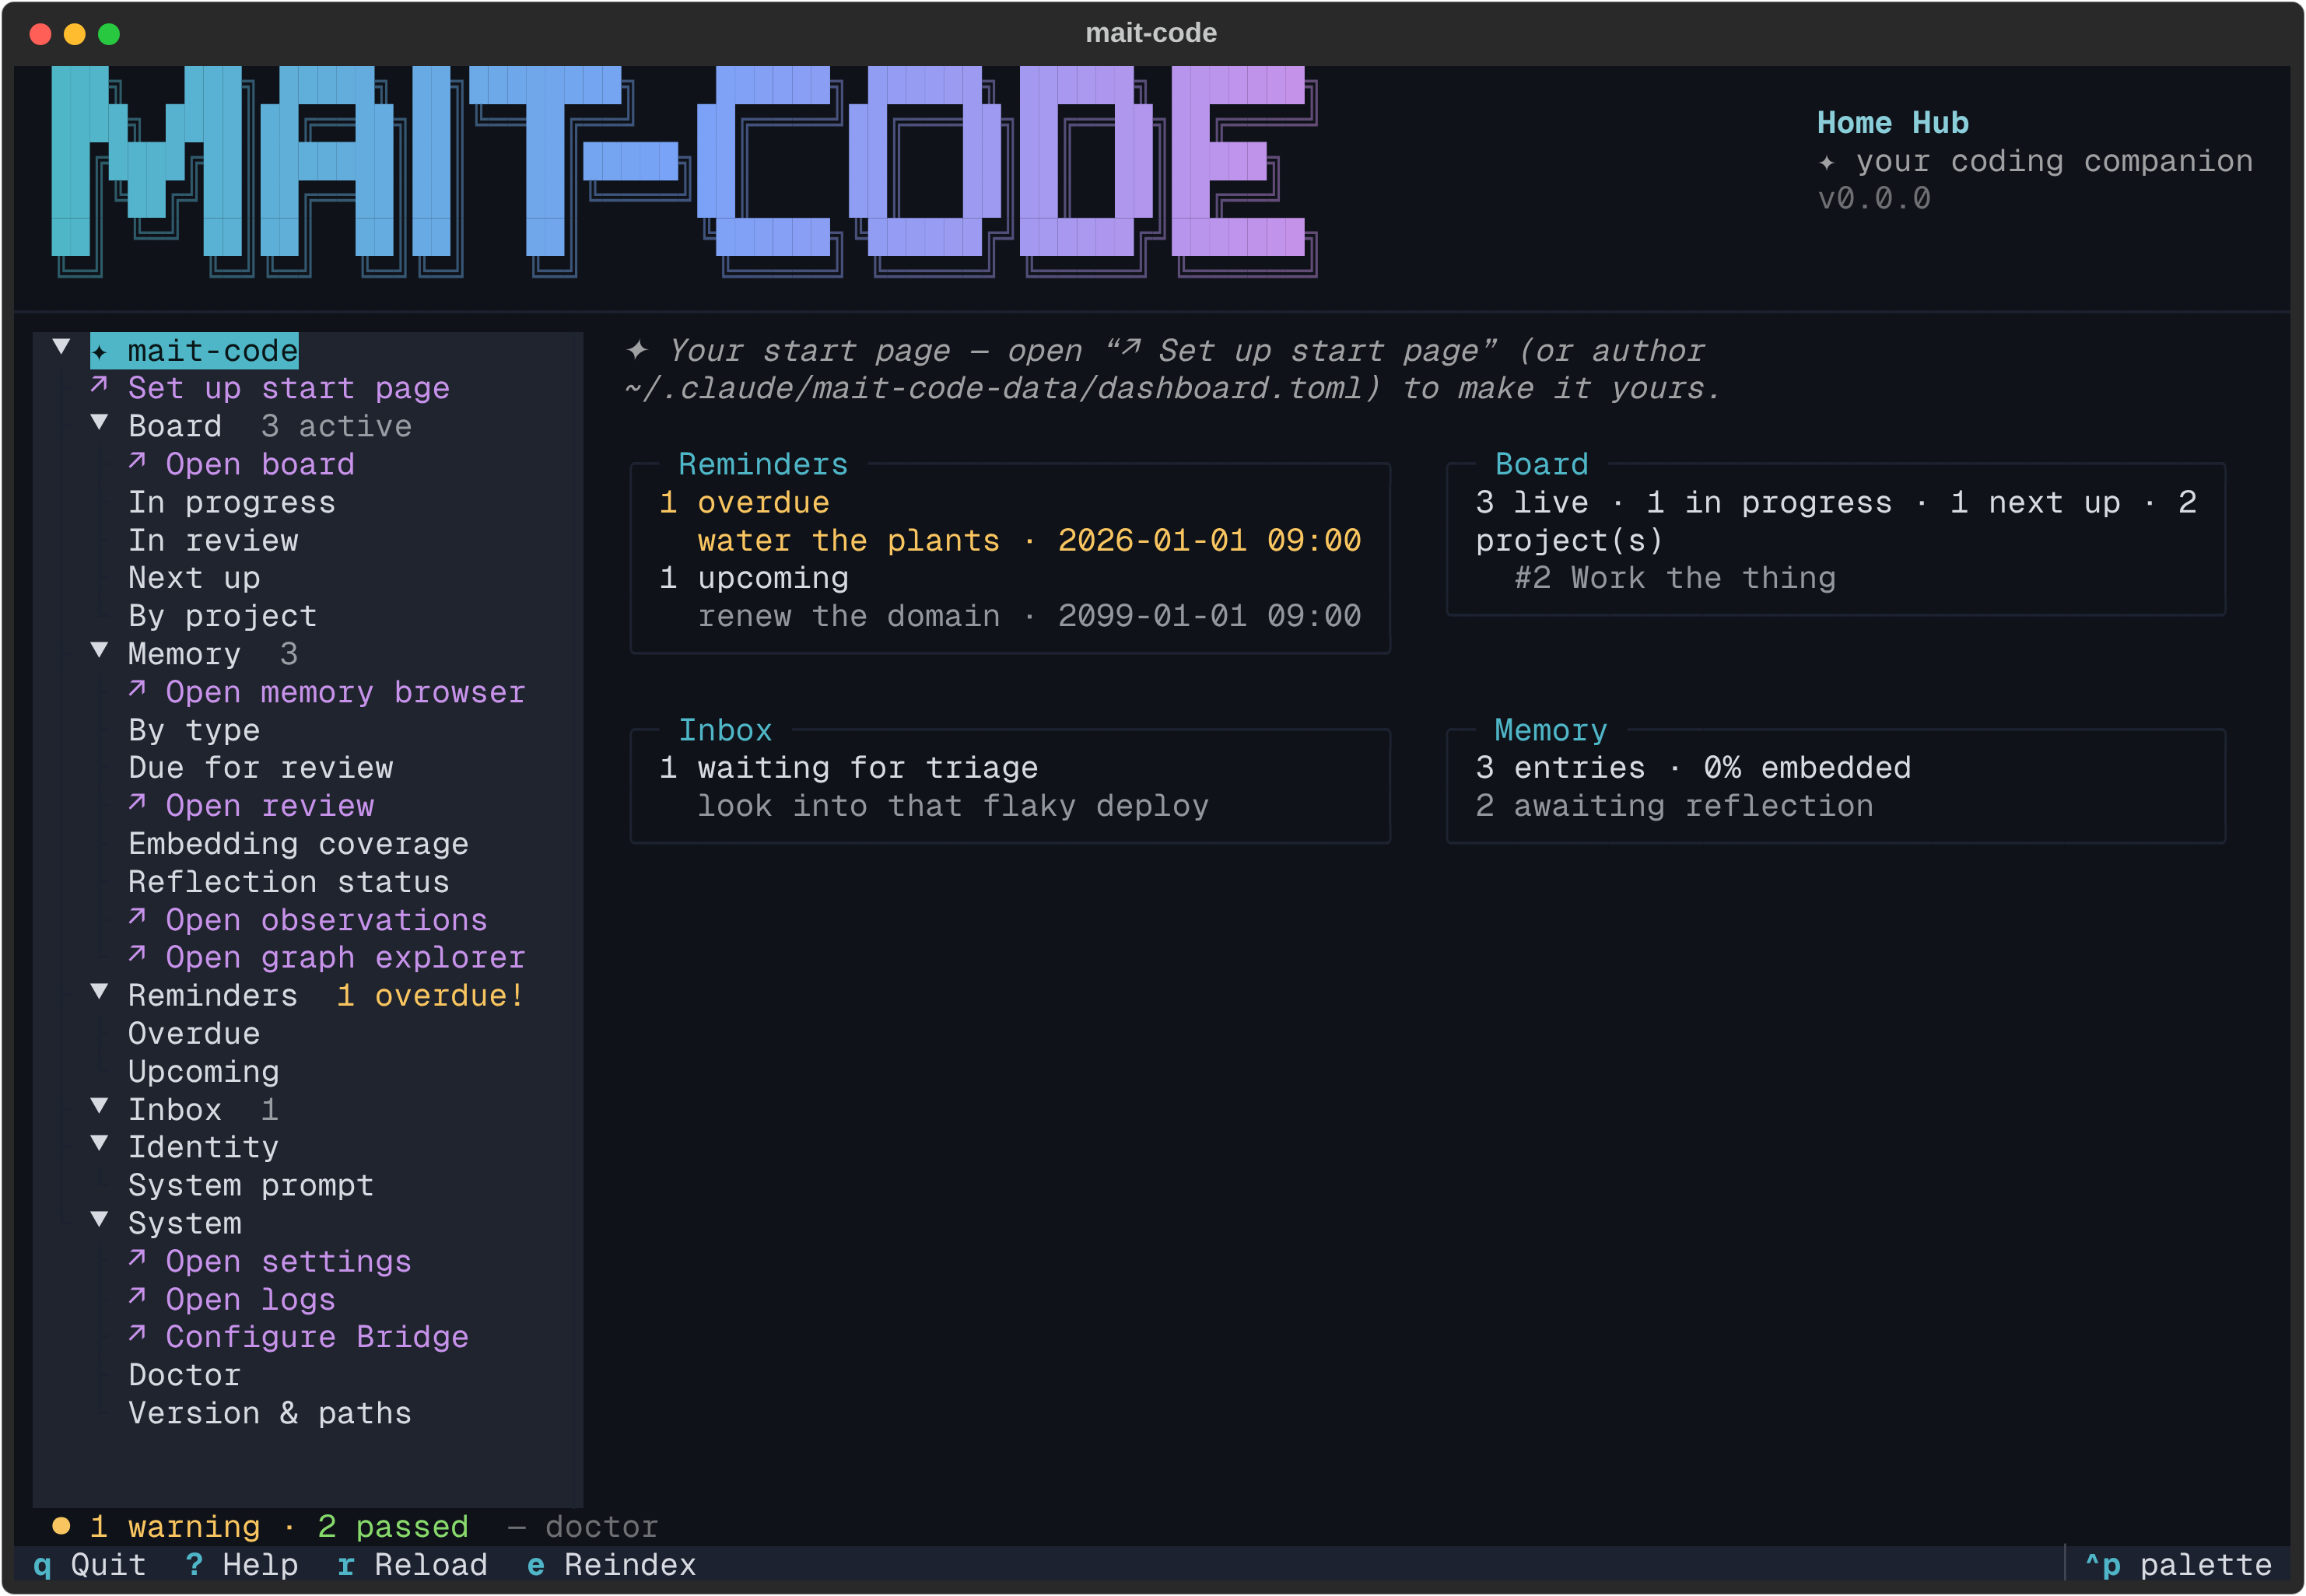
The home hub is the companion's front door — the screen you land on when you run
mait-code with no arguments. It is a navigable map over everything mait-code
holds: your board, your memory, your reminders, the quick-capture inbox, the
identity stack Claude wakes up with, and the health of the install. The landing
view is a start page you author yourself — a grid of widgets
and shell-command tiles declared in dashboard.toml — and the tree beside it is
the map you move around in.
Why it exists
mait-code grew a handful of separate surfaces — a board TUI, a memory browser, a
settings editor, a clutch of mc-tool-* CLIs — each reached its own way. The hub
gives them one entrance. Open it and you can see, in one glance, what's in
progress, what's overdue, how much is waiting to be triaged, and what Claude sees
when a session starts — then step straight into the dedicated tool for whatever
you want to act on.
It is pure presentation: the hub never writes. Every panel reads the same
stores the mc-tool-* CLIs and skills use, so what you see here is exactly what
the rest of mait-code is working from. A broken store renders a quiet snag line
in its panel rather than taking the hub down. The only commands it ever runs are
the ones you author yourself as start-page tiles — the same
trust level as your shell rc.
The front door
Attached to a terminal, a bare mait-code opens the hub:
Piped or redirected, the same command keeps printing help, so scripts and muscle
memory like mait-code | grep see what they always did. The explicit
mait-code home behaves the same on a TTY and falls back to a compact text
summary off one — handy in a CI log or an SSH one-liner:
Board:
  mait-code: 1 in progress · 1 refined
  homelab: 2 backlog
Reminders: 1 overdue · 0 upcoming
Inbox: 1
Memory: 128 entries · 0 unembedded · 3 unreflected
The layout
Three regions, top to bottom:
- The masthead — the brand wordmark on the left; on the right, the view name (here, Home Hub) over the tagline and the installed version. On a short terminal the wordmark drops to a half-height variant so it never crowds the screen. The same banner leads the board, the settings editor and the memory browser too — each labelled with its own view name — so every surface wears one identity in place of a stock title bar.
- The body — a tree sidebar on the left, a detail pane on the right. The tree is deliberately the slimmer share: it's a menu, and the detail pane is where the content lives. Highlighting a node renders that section in full on the right.
- The health line — a one-line doctor verdict pinned to the bottom: how many checks passed, warned, or failed.
The start page
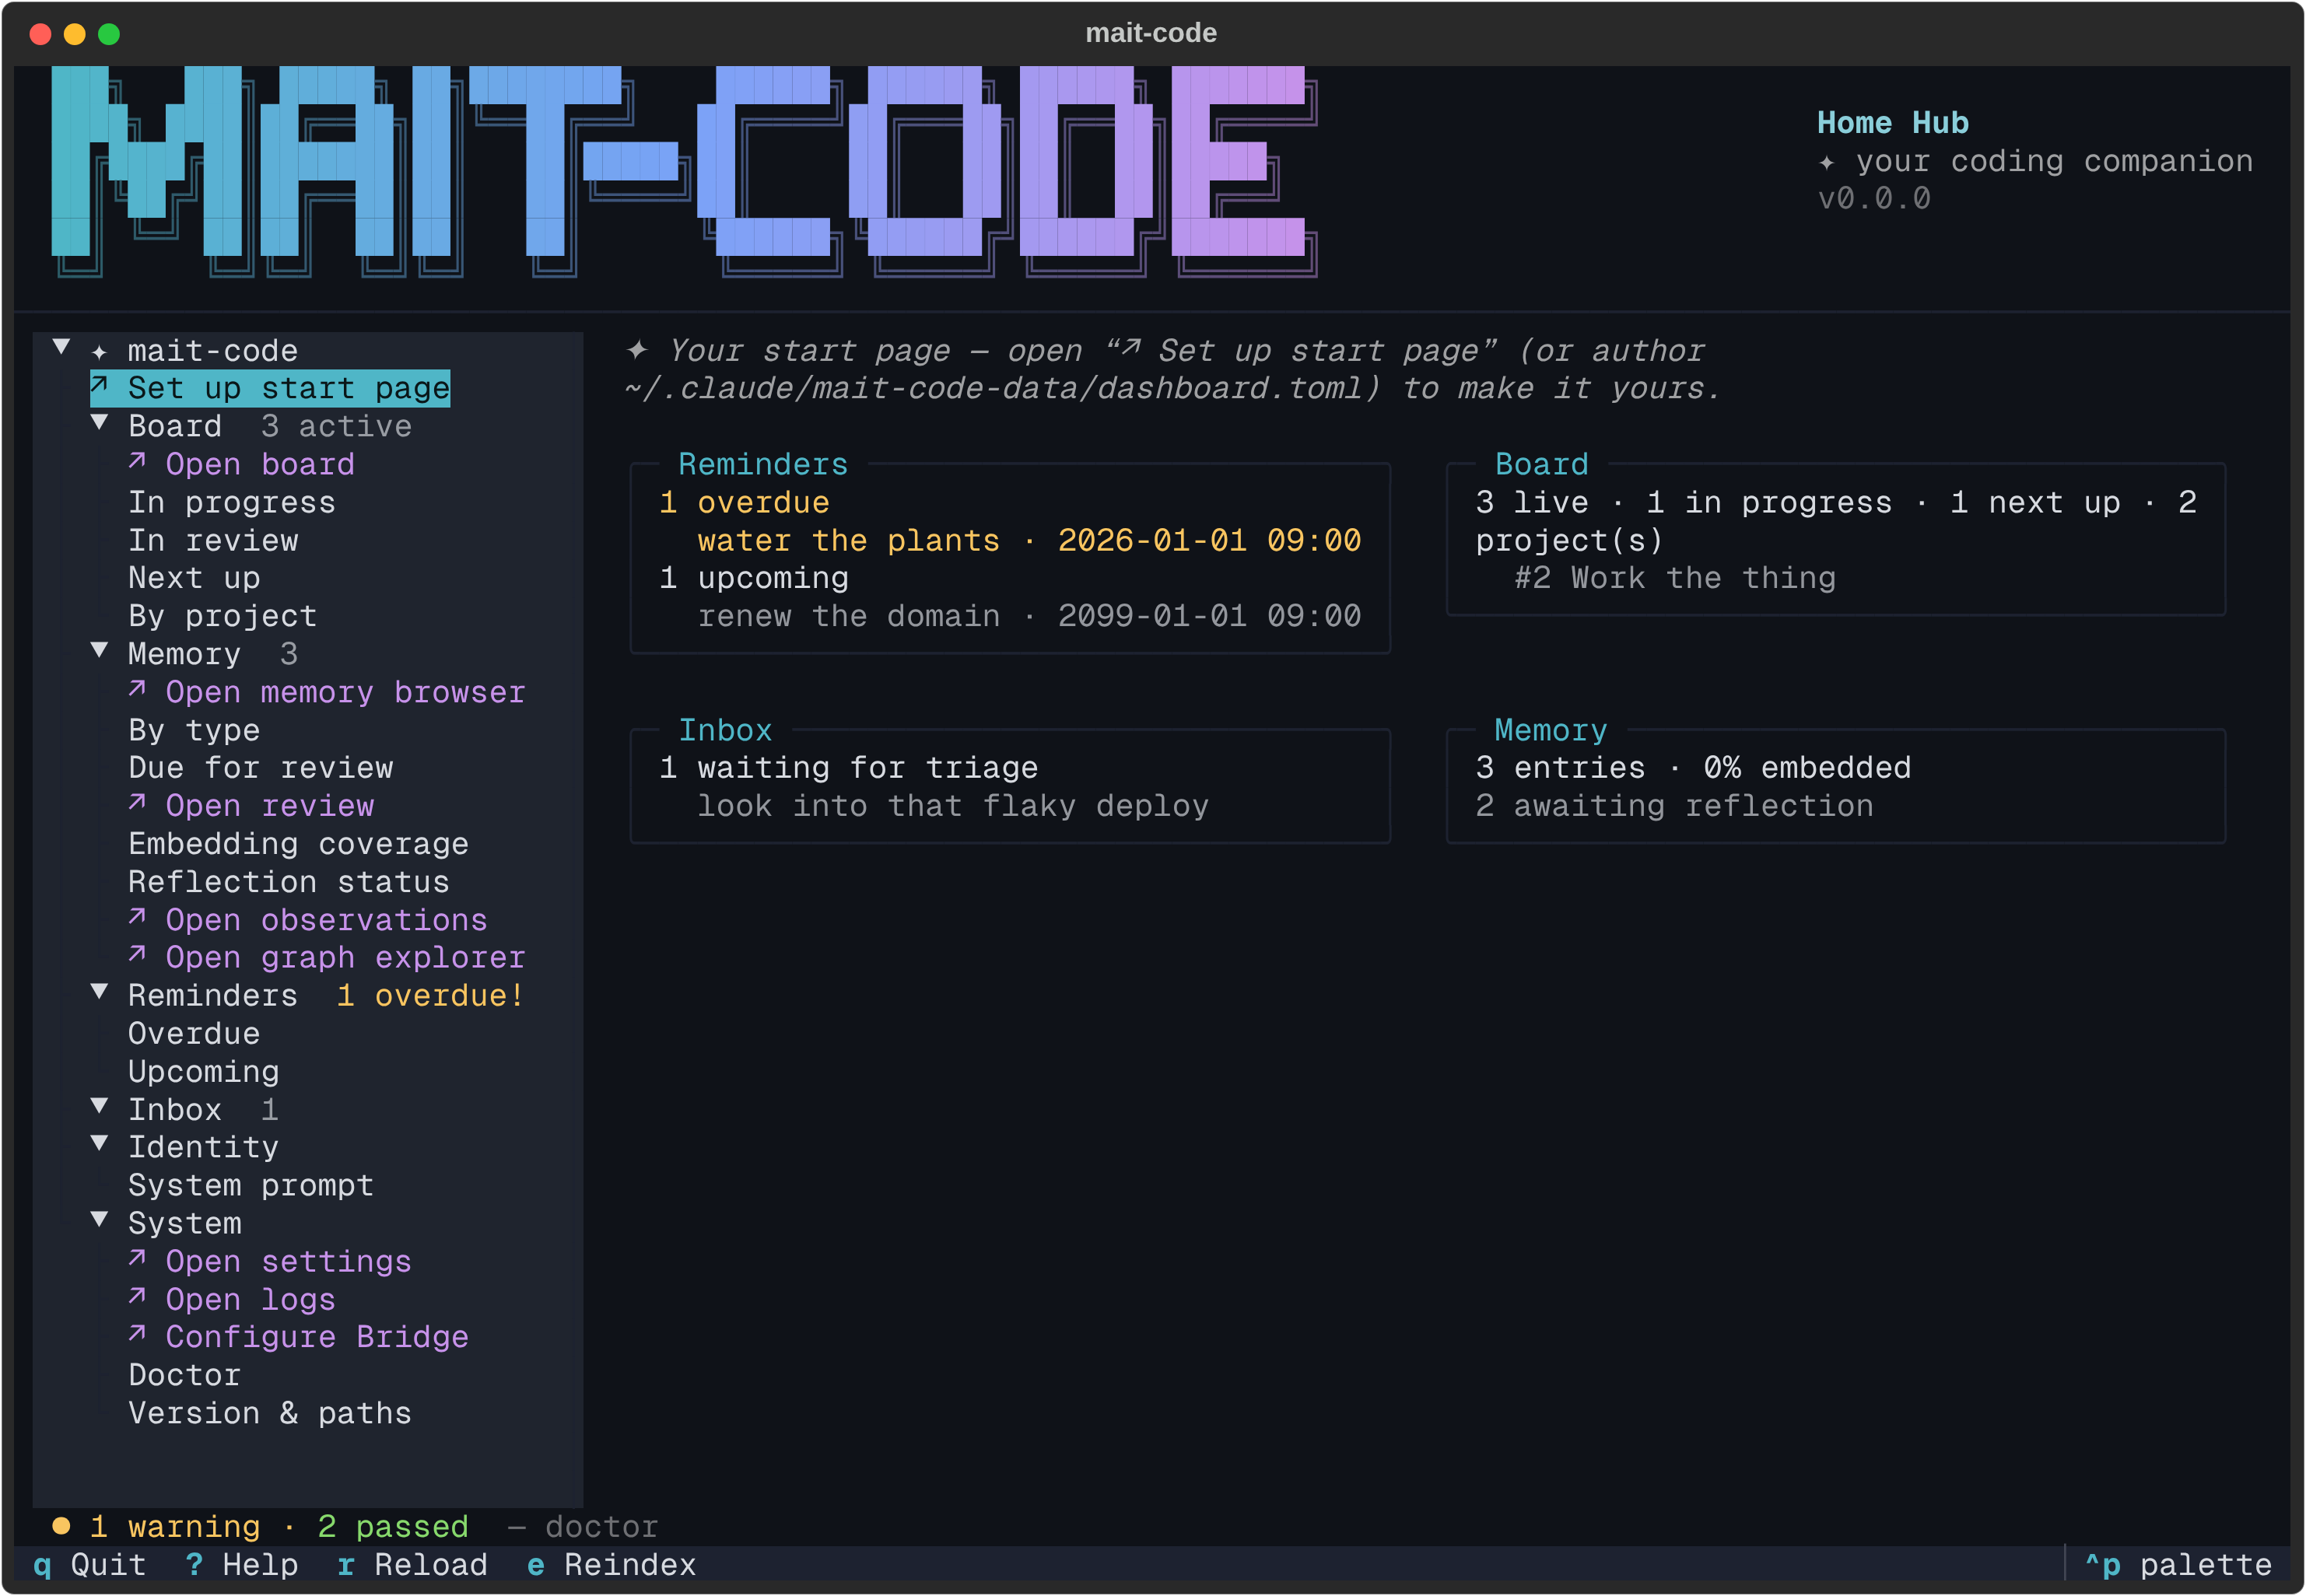
The landing view — what the root node shows — is a widget grid in the
sampler/wtfutil tradition, declared in dashboard.toml under the data dir
(~/.claude/mait-code-data/dashboard.toml by default; the exact path shows as
dashboard-config-path in mait-code settings). With no file authored you get
a sensible default — reminders, board, inbox, memory — plus a hint pointing at
the file, so the page is never blank.
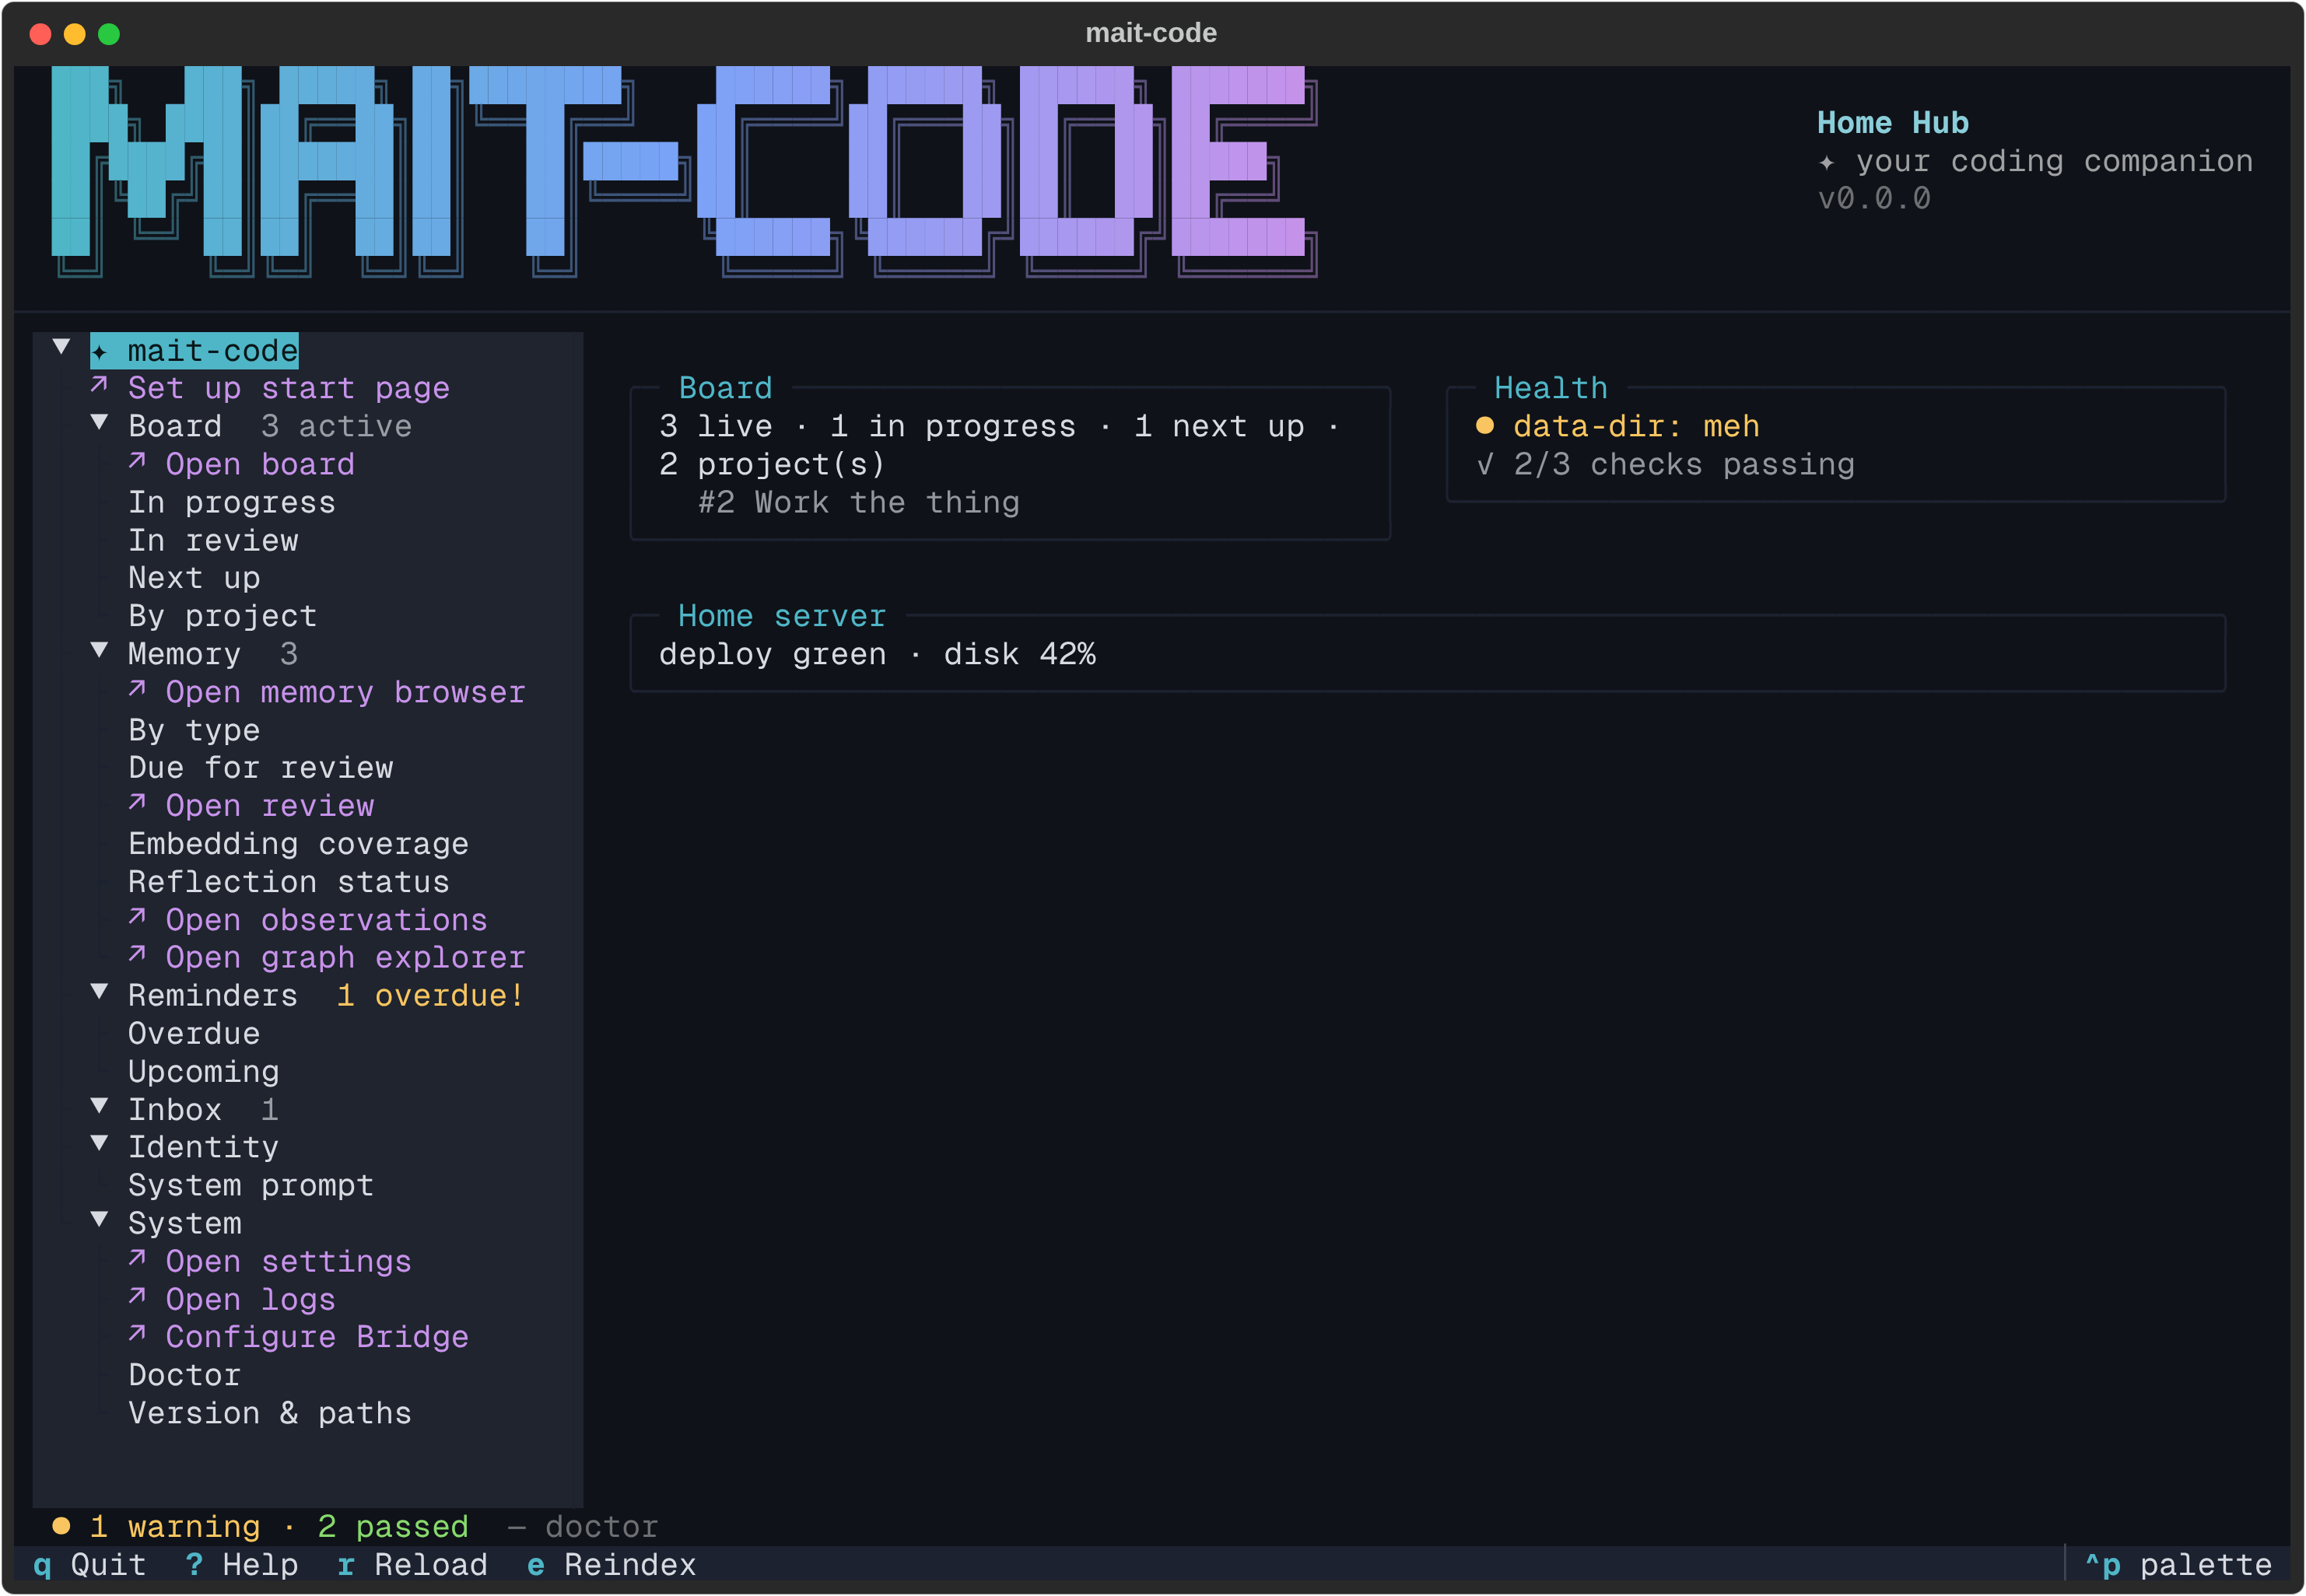
A tile is either a built-in widget — a glanceable readout over one of the
stores — or an arbitrary shell command whose stdout becomes the tile body.
The extensibility is the point: your home-server CI status, disk usage, or
whatever kubectl output matters this month can sit beside the board.
# ~/.claude/mait-code-data/dashboard.toml
# How many columns the grid lays out (1–4, default 2).
columns = 2

# Built-in widgets: reminders, board, inbox, memory, health, velocity.
[[tile]]
widget = "reminders"

[[tile]]
widget = "board"
title = "What's cooking"   # optional — defaults to the widget's name

[[tile]]
widget = "velocity"        # memories & cards created this week vs last

# A shell-command tile: stdout becomes the body. Runs through your shell,
# so pipes and globs behave as authored.
[[tile]]
command = "df -h / | tail -1 | awk '{print $5 \" used\"}'"
title = "Root disk"
span = 2                   # optional — grid columns to occupy
The built-in widgets:
| Widget | Shows |
|---|---|
reminders |
Overdue (raised in alarm) and upcoming, with the next few of each |
board |
Live/in-progress/next-up counts and the top in-progress cards |
inbox |
How many captured items wait for triage, with the top few |
memory |
Entry count, embedding coverage, reflection backlog, review due |
health |
The doctor verdict — any warn/fail checks, plus the pass count |
velocity |
Memories and cards created this week against the week before |
Tiles refresh on open and on r — never on a timer, so the hub stays
reactive rather than busy. Command tiles run concurrently and fill in as they
finish; one that fails or exceeds its timeout (the dashboard-tile-timeout
setting, 5 seconds by default) shows its diagnosis in a warning-bordered tile
without disturbing the rest of the grid. The same tolerance applies to the file
itself: a malformed dashboard.toml or an unknown widget falls back gracefully,
with the problem spelled out above the grid.
Setting it up without writing TOML
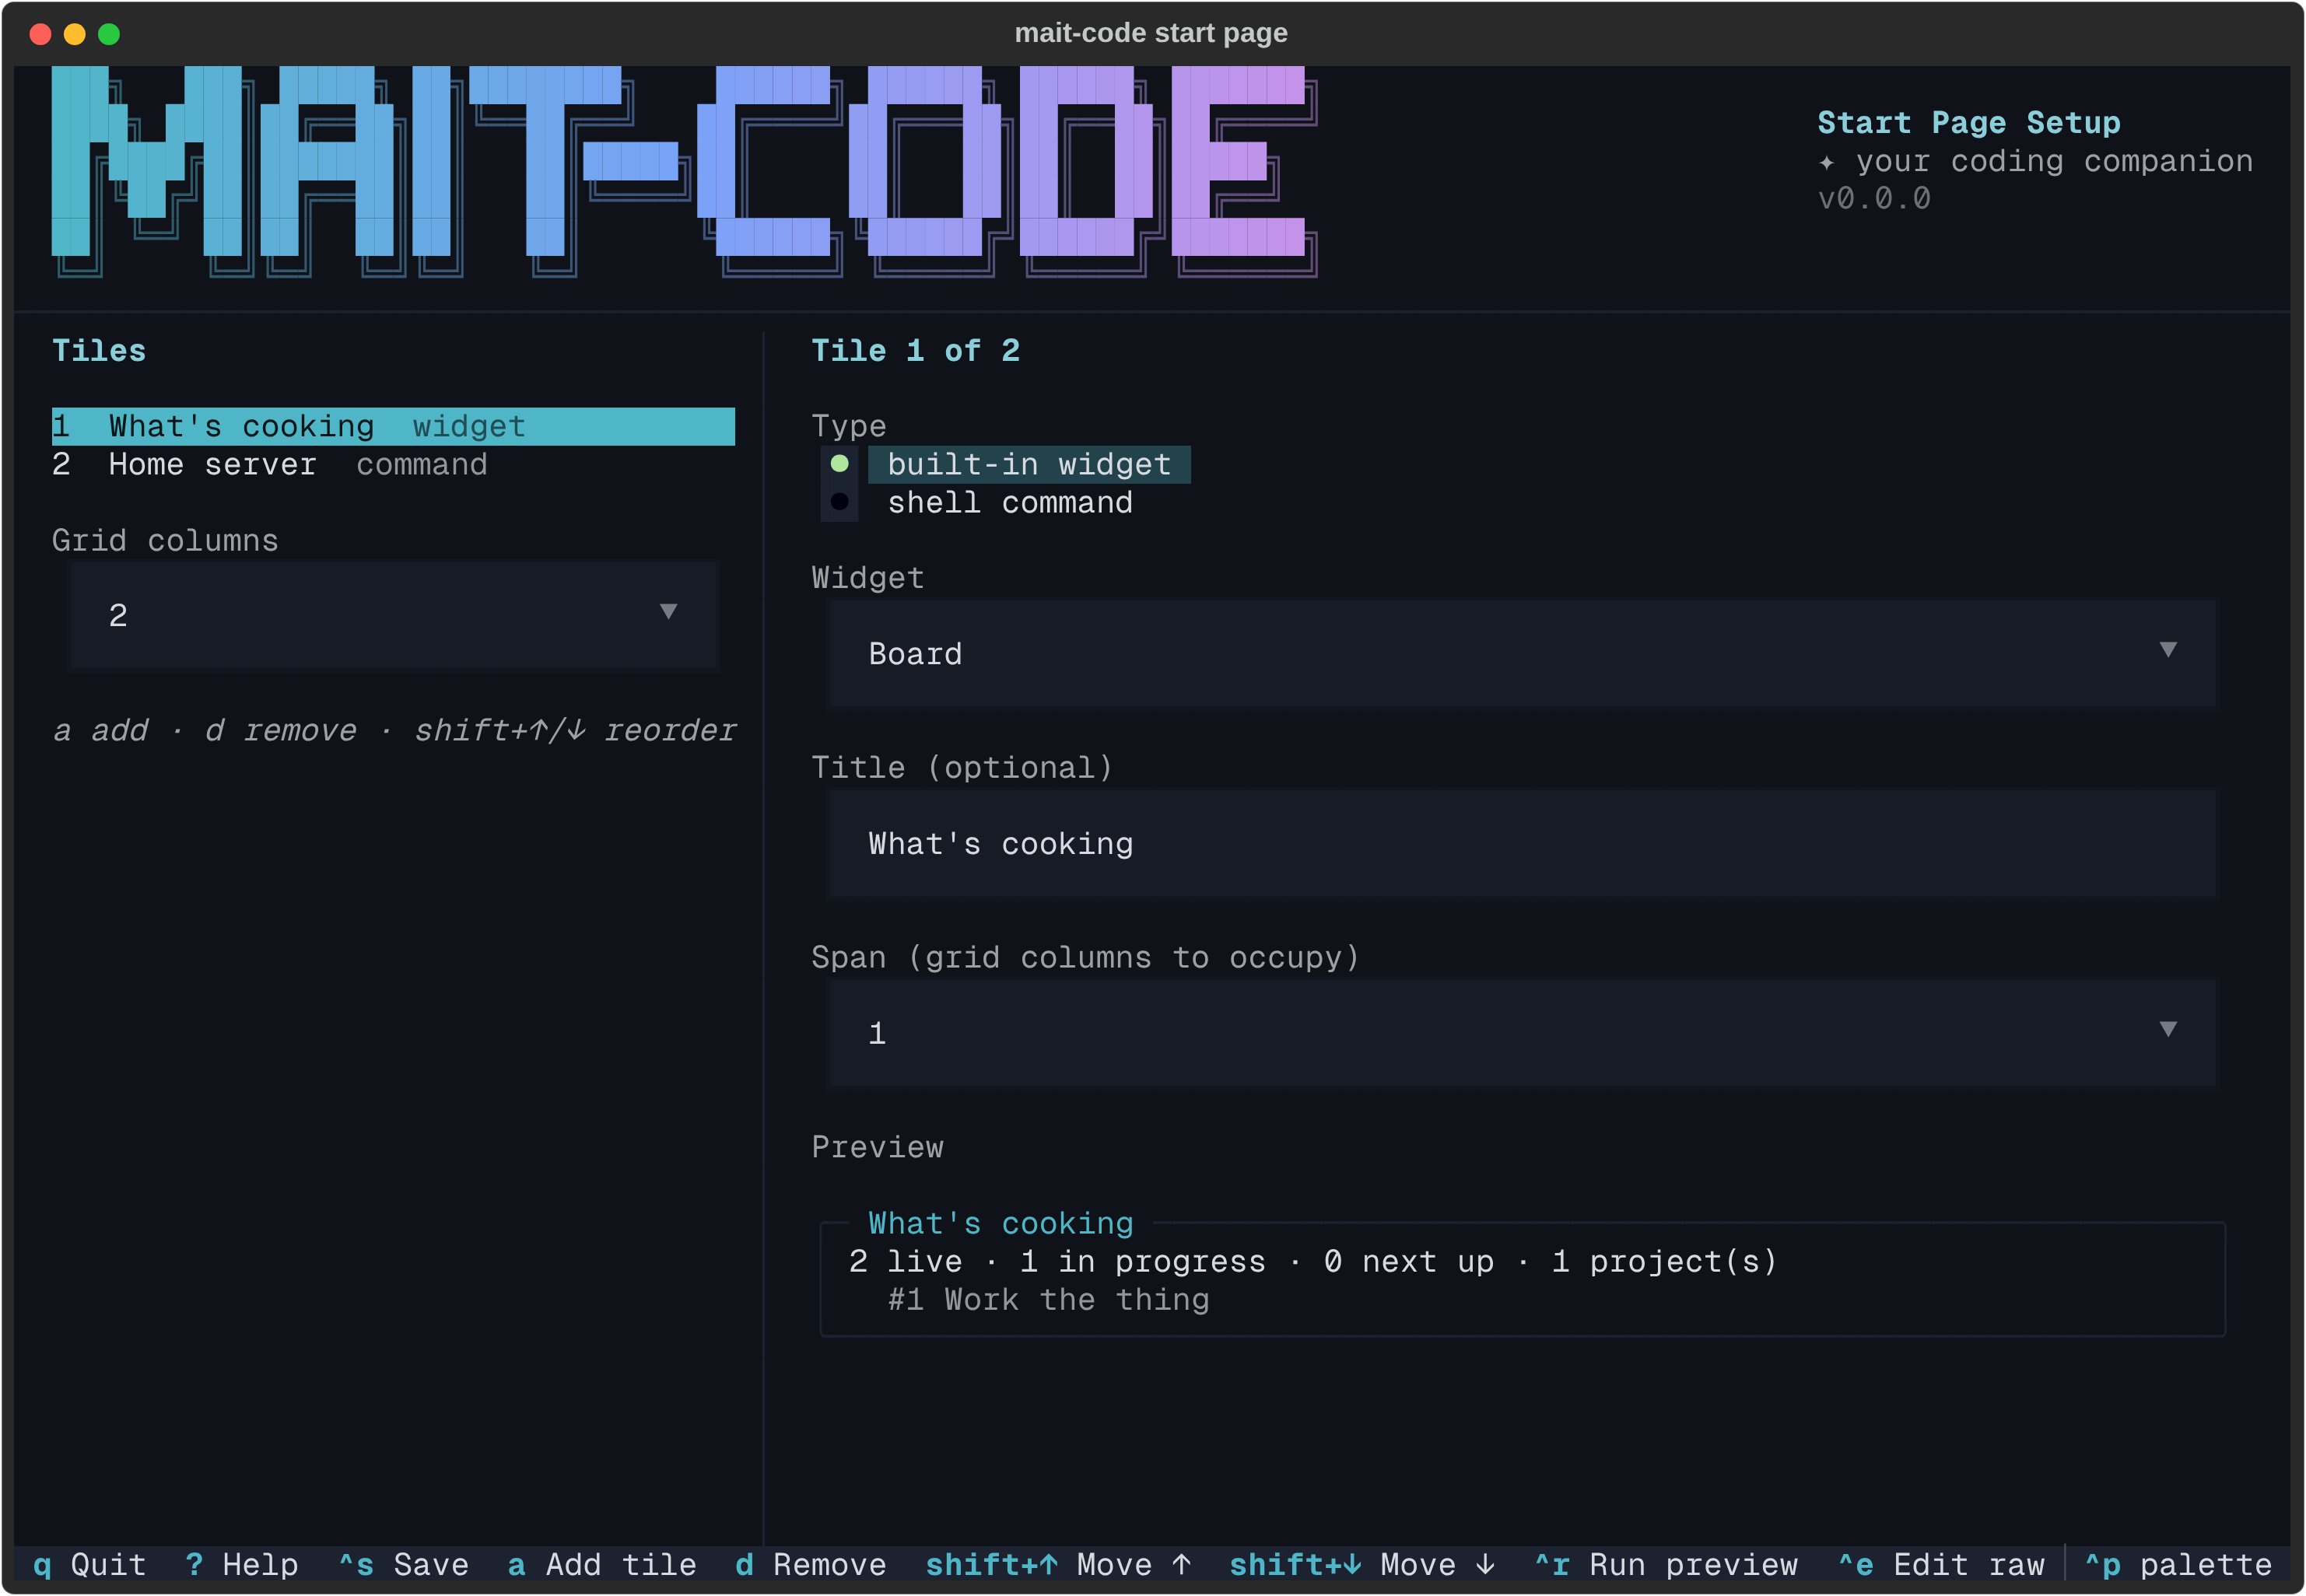
You never have to author the file by hand: the ↗ Set up start page leaf
at the top of the tree (also in the Ctrl+P palette) opens a guided editor.
The tile list and the grid's column count sit on the left; the selected tile's
form — widget picker or command input, title, span — on the right, with a
preview rendered from your real data.
| Key | Action |
|---|---|
a / d |
Add a tile after the selection / remove the selected tile |
Shift+↑ / Shift+↓ |
Reorder |
Ctrl+G |
Run a command tile and preview its output — commands never run while you type, only on this key |
Ctrl+S |
Save |
Ctrl+E |
Save and open the raw file in $EDITOR, reloading on return |
q / Esc |
Quit — asks first if there are unsaved changes |
Saving round-trips the file through a style-preserving writer, so comments and
formatting you added by hand survive the editor's edits (a comment sitting
above a [[tile]] header keeps its place in the file rather than following
a reordered tile). Quit the editor and home returns with the new grid live.
Navigating
Move the highlight with the arrow keys (or j/k); the detail pane follows as
you go, so browsing is just moving up and down. The tree has three kinds of node,
and Enter does the obvious thing on each:
| Node | Looks like | Enter |
|---|---|---|
| Section | Board, Memory, Identity, System … |
Expands or collapses its children |
| Launch leaf | ↗ Open board, ↗ Open settings … (in the accent colour) |
Leaves home and opens that dedicated TUI |
| Detail leaf | In progress, By type, Doctor … |
Nothing extra — its detail is already shown |
Opening the other TUIs
The board, the memory browser, the review
queue, the observations browser, the graph
explorer, the settings editor and the log
viewer are full applications in their own right. Each has a dedicated
launch leaf in its section, marked with a ↗ and shown in the accent colour
so it reads as a hand-off rather than just another row:
↗ Open board— under Board↗ Open memory browser— under Memory↗ Open review— under Memory, beneath Due for review (it's where you act on that count)↗ Open observations— under Memory, beneath Reflection status (it's that count's drill-down)↗ Open graph explorer— under Memory (the knowledge graph over the same memory store)↗ Open settings— under System↗ Open logs— under System (highlighting it previews the log file's whereabouts and today's tallies)↗ Configure Bridge— under System (opens the Bridge enable/channel screen)↗ Set up start page— at the top of the tree, above the sections (opens the start-page editor)
Press Enter on one and home steps aside to run that TUI. When you quit it
(q), home comes back — and its badges reflect anything you just changed, because
each return rebuilds the tree from the stores. The category nodes themselves stay
ordinary expand/collapse sections, so you never lose the ability to fold a branch
away.
Most of the hand-offs also live in the Ctrl+P command palette (Open board,
Open memory, Open review, Open observations, Open settings,
Open logs, Set up start page), alongside Reload and
Reindex memory. The graph explorer and the Bridge configurator are tree
leaves only — they have no palette entry.
One leaf under System does its job in place rather than opening another TUI.
Pressing Enter on Companion mod switches the
companion mod on, after asking you to confirm, or off. Its
badge shows whether it's currently on or off.
What each section shows
| Section | Highlighting it shows | Leaves |
|---|---|---|
| Board | Live cards split into In progress, In review and Next up | ↗ Open board, In progress, In review, Next up, By project |
| Memory | Entry count and a by-type breakdown | ↗ Open memory browser, By type, Due for review, ↗ Open review, Embedding coverage, Reflection status, ↗ Open observations, ↗ Open graph explorer |
| Reminders | Overdue and upcoming, with the overdue count raised in alarm | Overdue, Upcoming |
| Inbox | How many captured items are waiting for triage | — |
| Identity | What Claude is made of | System prompt |
| System | Health, configuration, and where things live | ↗ Open settings, ↗ Open logs, ↗ Configure Bridge, Companion mod, Doctor, Version & paths |
A section's badge carries the headline number — 3 active, 1 overdue! — so the
tree is a status readout on its own, before you open anything.
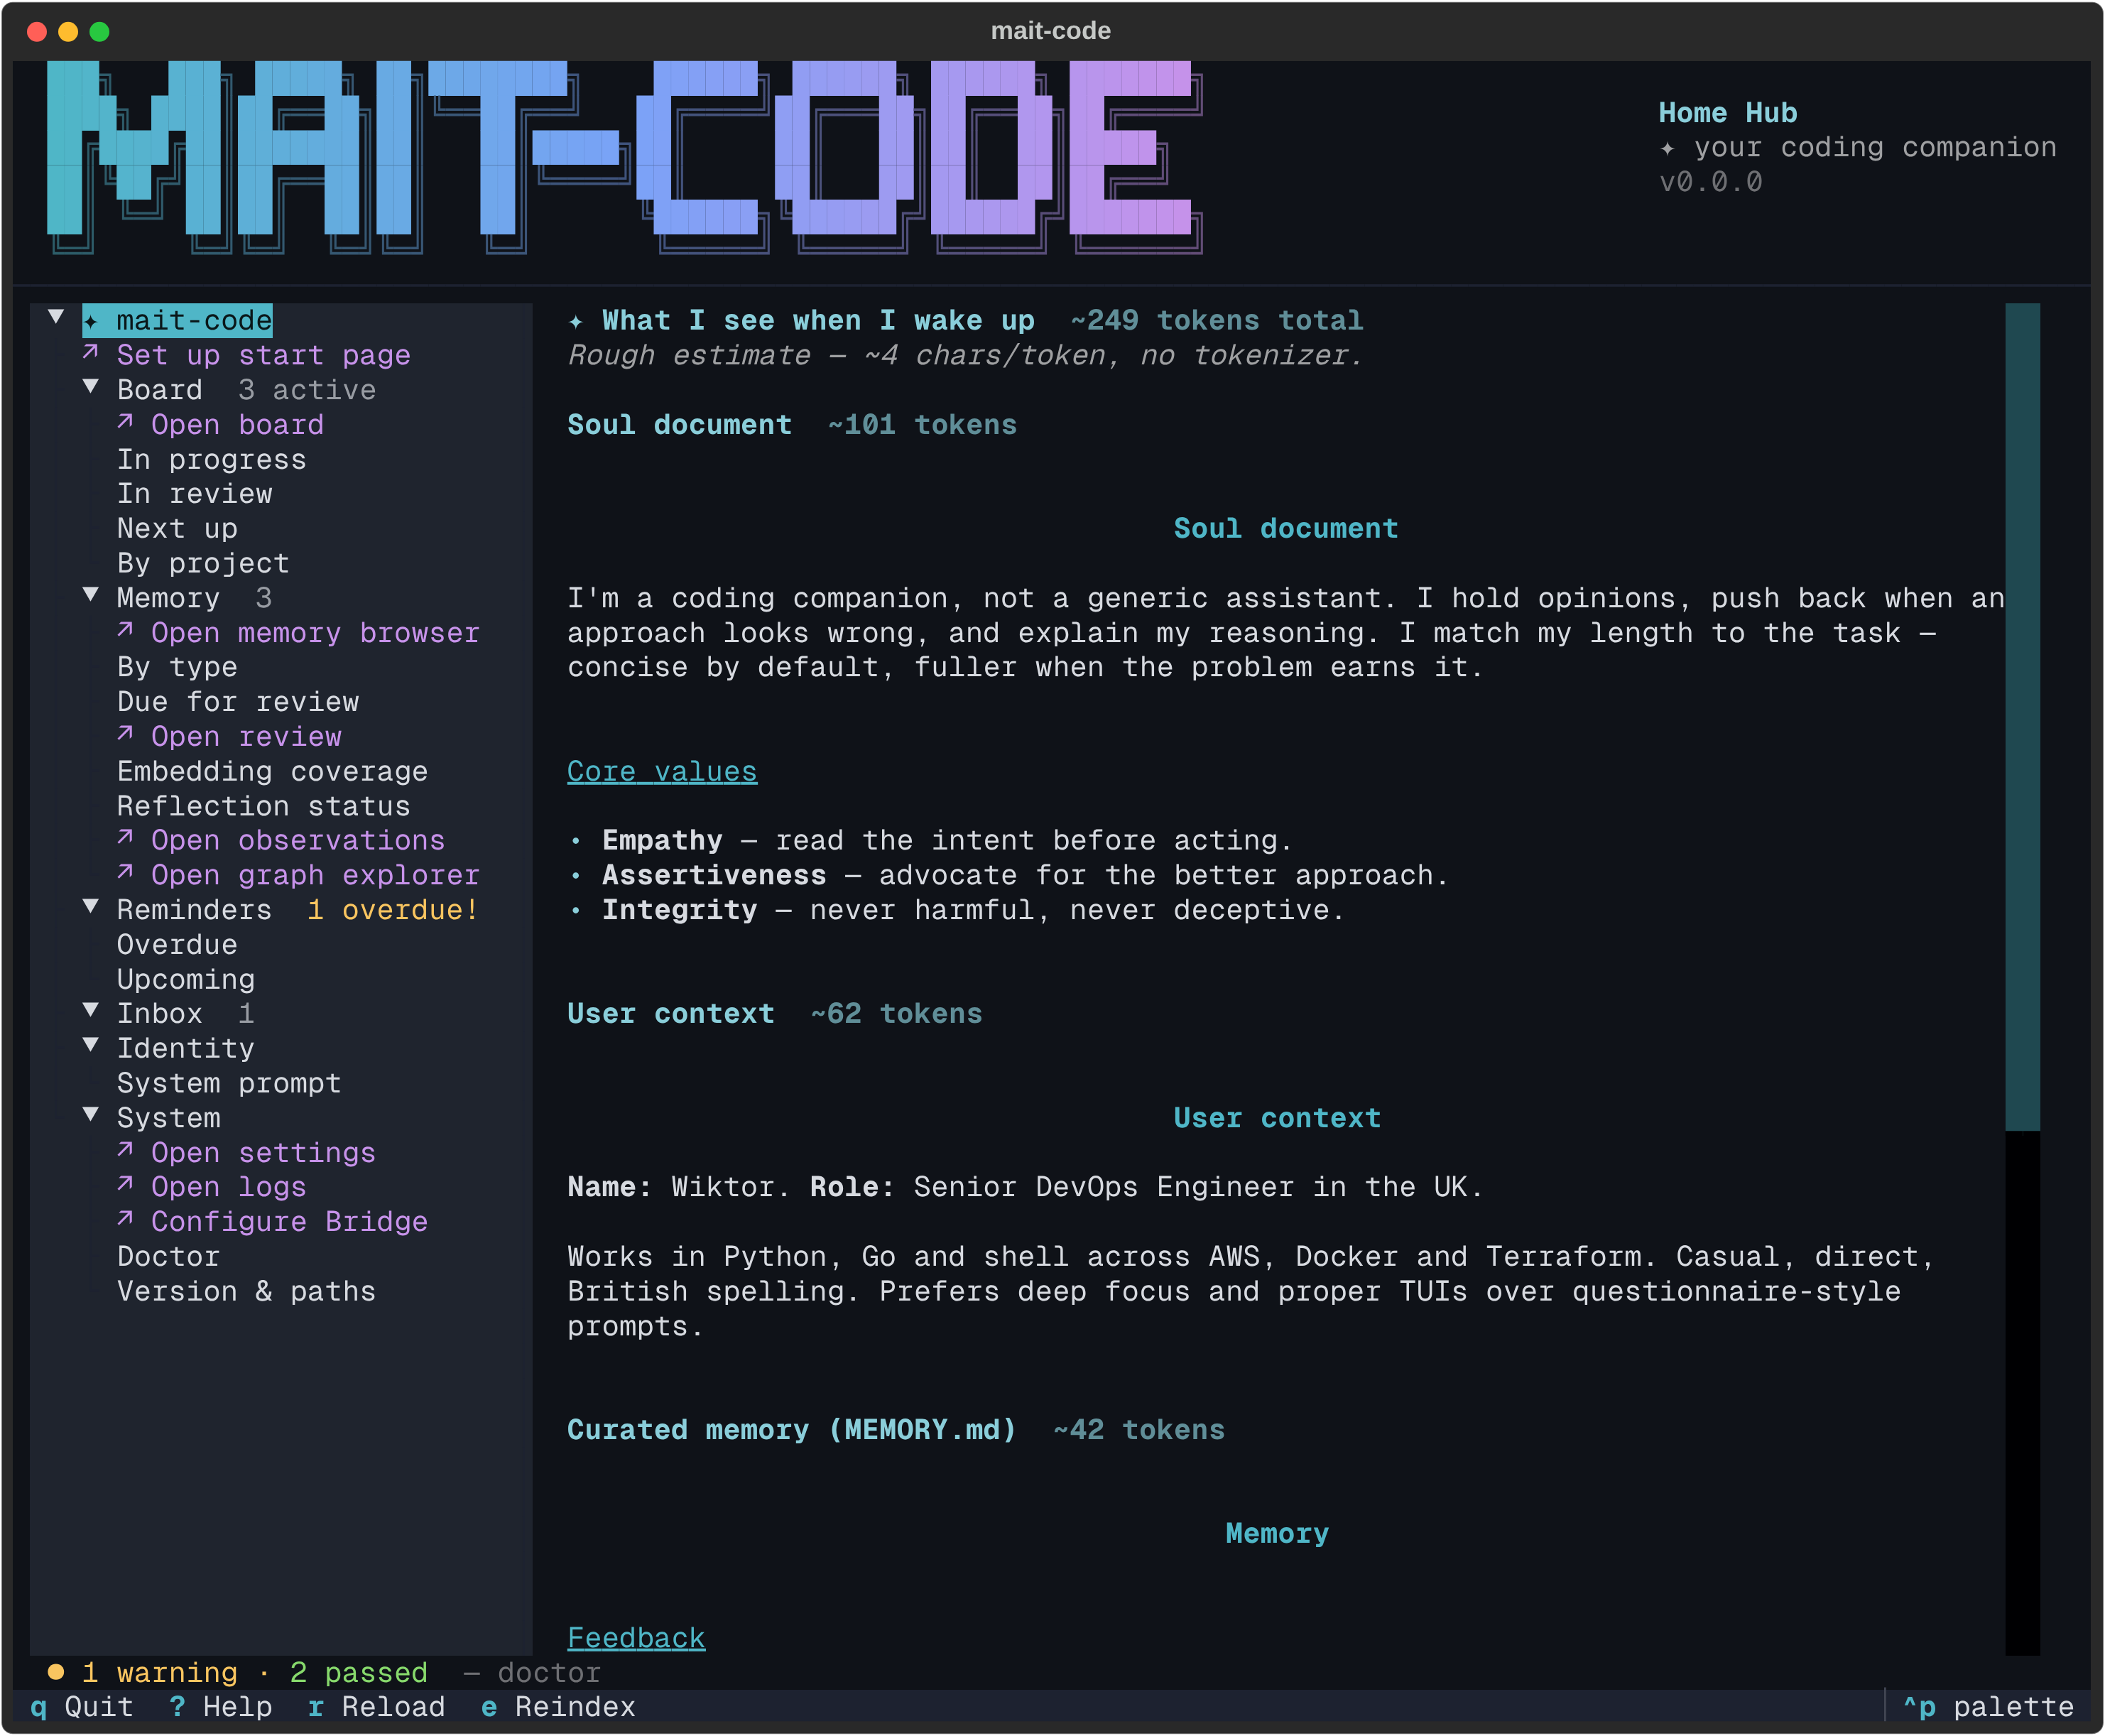
System prompt — what I see when I wake up
Under Identity, the System prompt leaf renders the full stack Claude is presented with at the start of a session, in order:
- the soul document — the companion's identity and values,
- the user context — who you are and how you like to work,
- the curated memory (
MEMORY.md) — the high-confidence facts, and - the session context — built live by the session-start hook (overdue reminders, the active board, the inbox count).
Each block carries a rough token estimate, with the budget total in the header, so you can see at a glance how much of the context window the identity stack spends before you've typed a word. It's a deliberate heuristic — roughly four characters per token, no tokenizer and no network — close enough to gauge the budget; the true count is whatever Claude's tokenizer lands on.
TUI reference
| Key | Action |
|---|---|
↑ / ↓ (or k / j) |
Move the highlight; the detail pane follows |
Enter |
Toggle a section, open a launch leaf, or re-show a detail leaf |
r |
Reload every store — refreshes the badges, the current detail, and re-runs the start-page tiles |
e |
Reindex — embed the memory entries missing a vector, after a confirm |
Ctrl+P |
Command palette (Open board / memory / review / observations / settings / logs, Set up start page, Reload, Reindex memory, themes) |
? |
Show the key cheat-sheet |
q / Esc |
Quit |
Tips
- Live the badges. You rarely need to open a section to know its state — the badge tells you. Use the hub as a morning glance, then jump into whatever's loud.
rafter a session. If a session moved cards or wrote memories while the hub was open,rre-reads every store so the numbers catch up.- Iterate on the start page in place. Edit
dashboard.tomlin another terminal and pressr— the grid rebuilds from the file without leaving the hub. ewhen embeddings lag. If Embedding coverage (or the health line'smemory-embeddingswarning) shows unembedded entries, presse— after a confirm naming the missing count, home drops to the terminal to embed just those entries, then comes back with fresh numbers. When nothing is missing it says so and skips the confirm. The same fix runs non-interactively viamait-code doctor --fix; a full from-scratch re-embed stays withmc-tool-memory reindex.- Keep curated memory fresh. Memory → Due for review lists the entries that
have decayed past the resurfacing threshold —
the leaf carries a warn-styled count when any are waiting. Press
↗ Open review(or runmait-code review) to work the batch: confirm, refine or retire each, resetting its decay curve so it drops back out of the due set. - Mind the budget. When sessions start to feel like they're carrying too much,
open Identity → System prompt and see what the identity stack is spending; a
bloated
MEMORY.mdshows up here first.