The log viewer
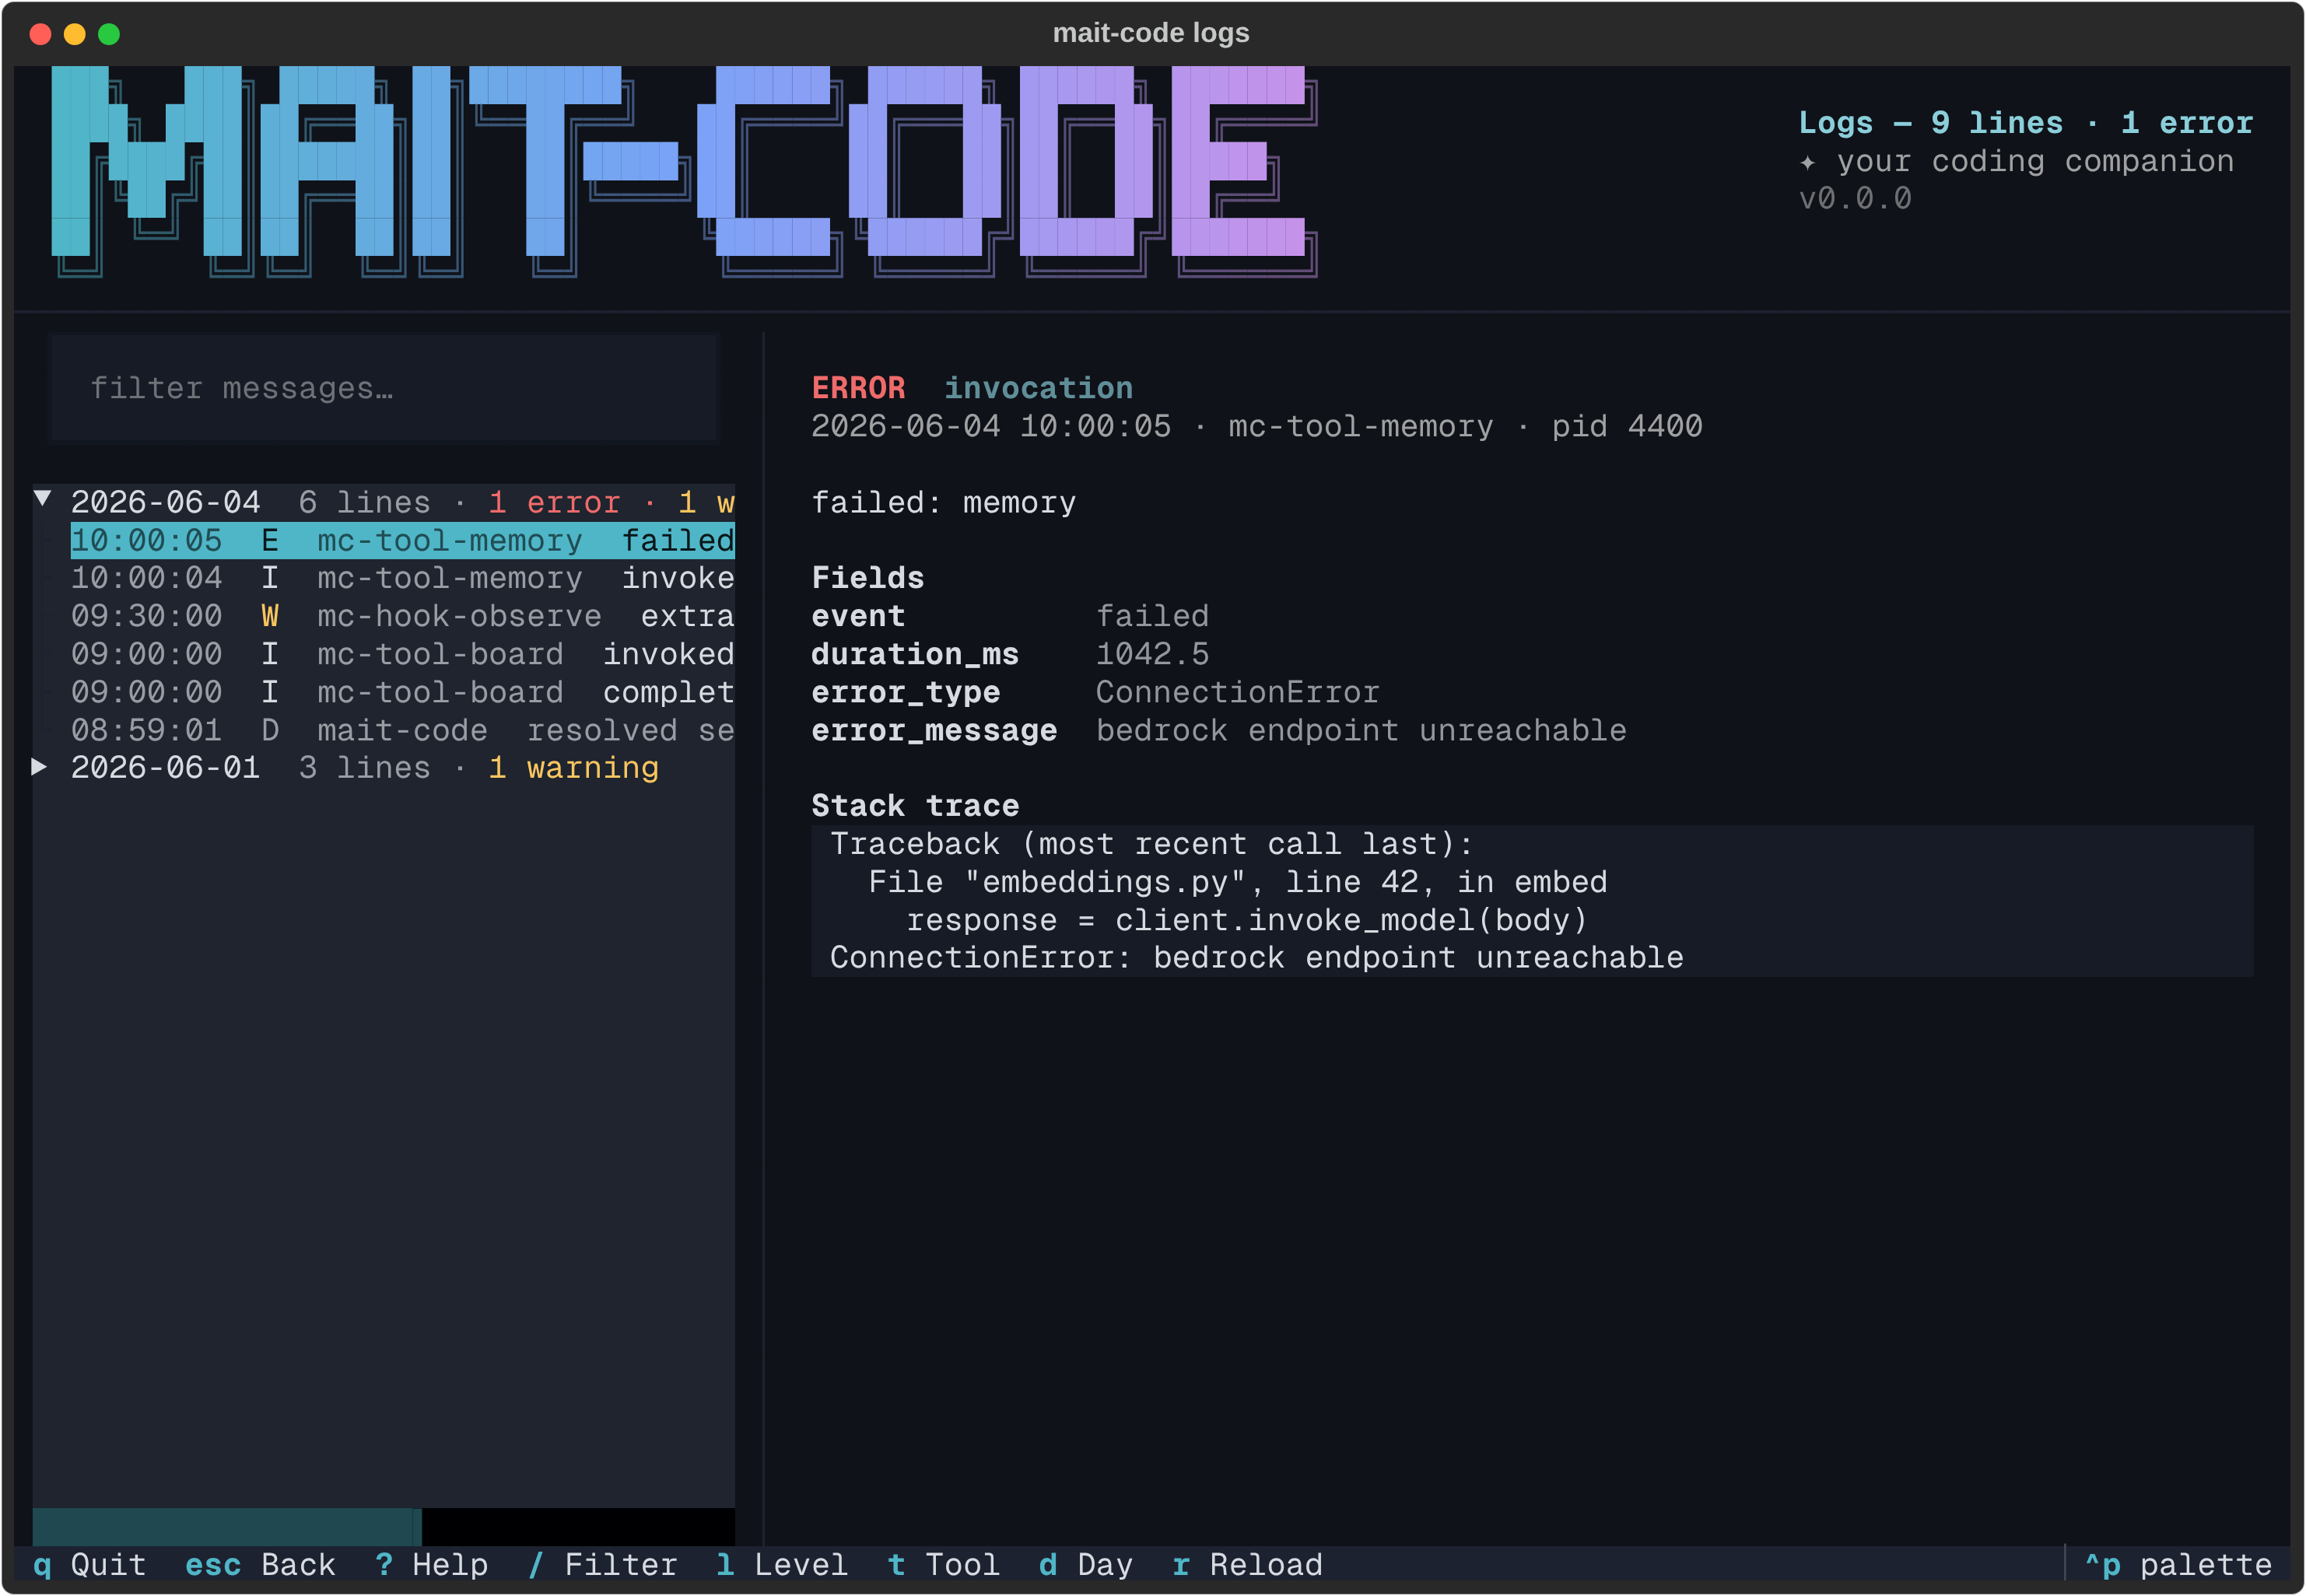
mait-code logs is a full-screen, read-only window onto the structured
logs every mait-code tool and hook writes — one JSON line per event, rotated
daily. Where the files themselves are built for machines (jq, shipping,
grepping), this is the place you read them: a tree of log lines grouped by
day on the left, the selected line's full record — message, fields, invocation
arguments, stack trace — on the right.
Why it exists
mait-code's tools and hooks log to file only — never to the terminal, where
output would corrupt hook JSON or tool results. That makes the logs the one
place failures land: a hook that died quietly, a tool invocation that took ten
seconds, an embedding call that fell over. Before this viewer, reading them
meant jq over ~/.local/state/mait-code/mait-code.jsonl; now the home hub's
System ▸ Open logs (or mait-code logs directly) gives the same answers
interactively — what failed today, where, and why.
It is deliberately read-only. Nothing here writes, truncates or rotates; the files belong to the logging layer (the structured schema is documented in the API reference).
The layout
Three regions, top to bottom:
- The masthead — the shared brand banner, labelled Logs, with the line
and error tallies folded into its subtitle, plus every active filter
(
Logs — 214 lines · 3 errors · ≥ warning · mc-tool-board · 12/214 match) — the view is never silently narrowed. - The body — a filter box over a tree on the left, the detail pane (the wider share) on the right.
- The footer — the live key hints.
The tree groups lines by day, newest first — the active file plus its
daily-rotated siblings (mait-code.jsonl.YYYY-MM-DD). The newest day opens
expanded; older days stay collapsed behind their counts, each day badged with
its line tally and any warning/error counts in the theme's semantic colours.
Each leaf reads <time> <level> <tool> <message>, with the level as a
single coloured letter (D/I/W/E).
Malformed lines — a truncated write, a stray non-JSON line — are skipped, and a pathologically large file is read from its tail (the subtitle says when either happened).
Reading a line
Highlight a leaf and the detail pane renders the full record:
- a title — the level (in its colour) and the logger,
- a metadata line — timestamp, tool, pid,
- the message,
- the line's fields — the invocation event, duration, parsed arguments, and anything a call site merged in; short values align into a key→value column, long ones (arguments, error messages) get their own wrapped block,
- and the stack trace, preformatted, when the line captured one.
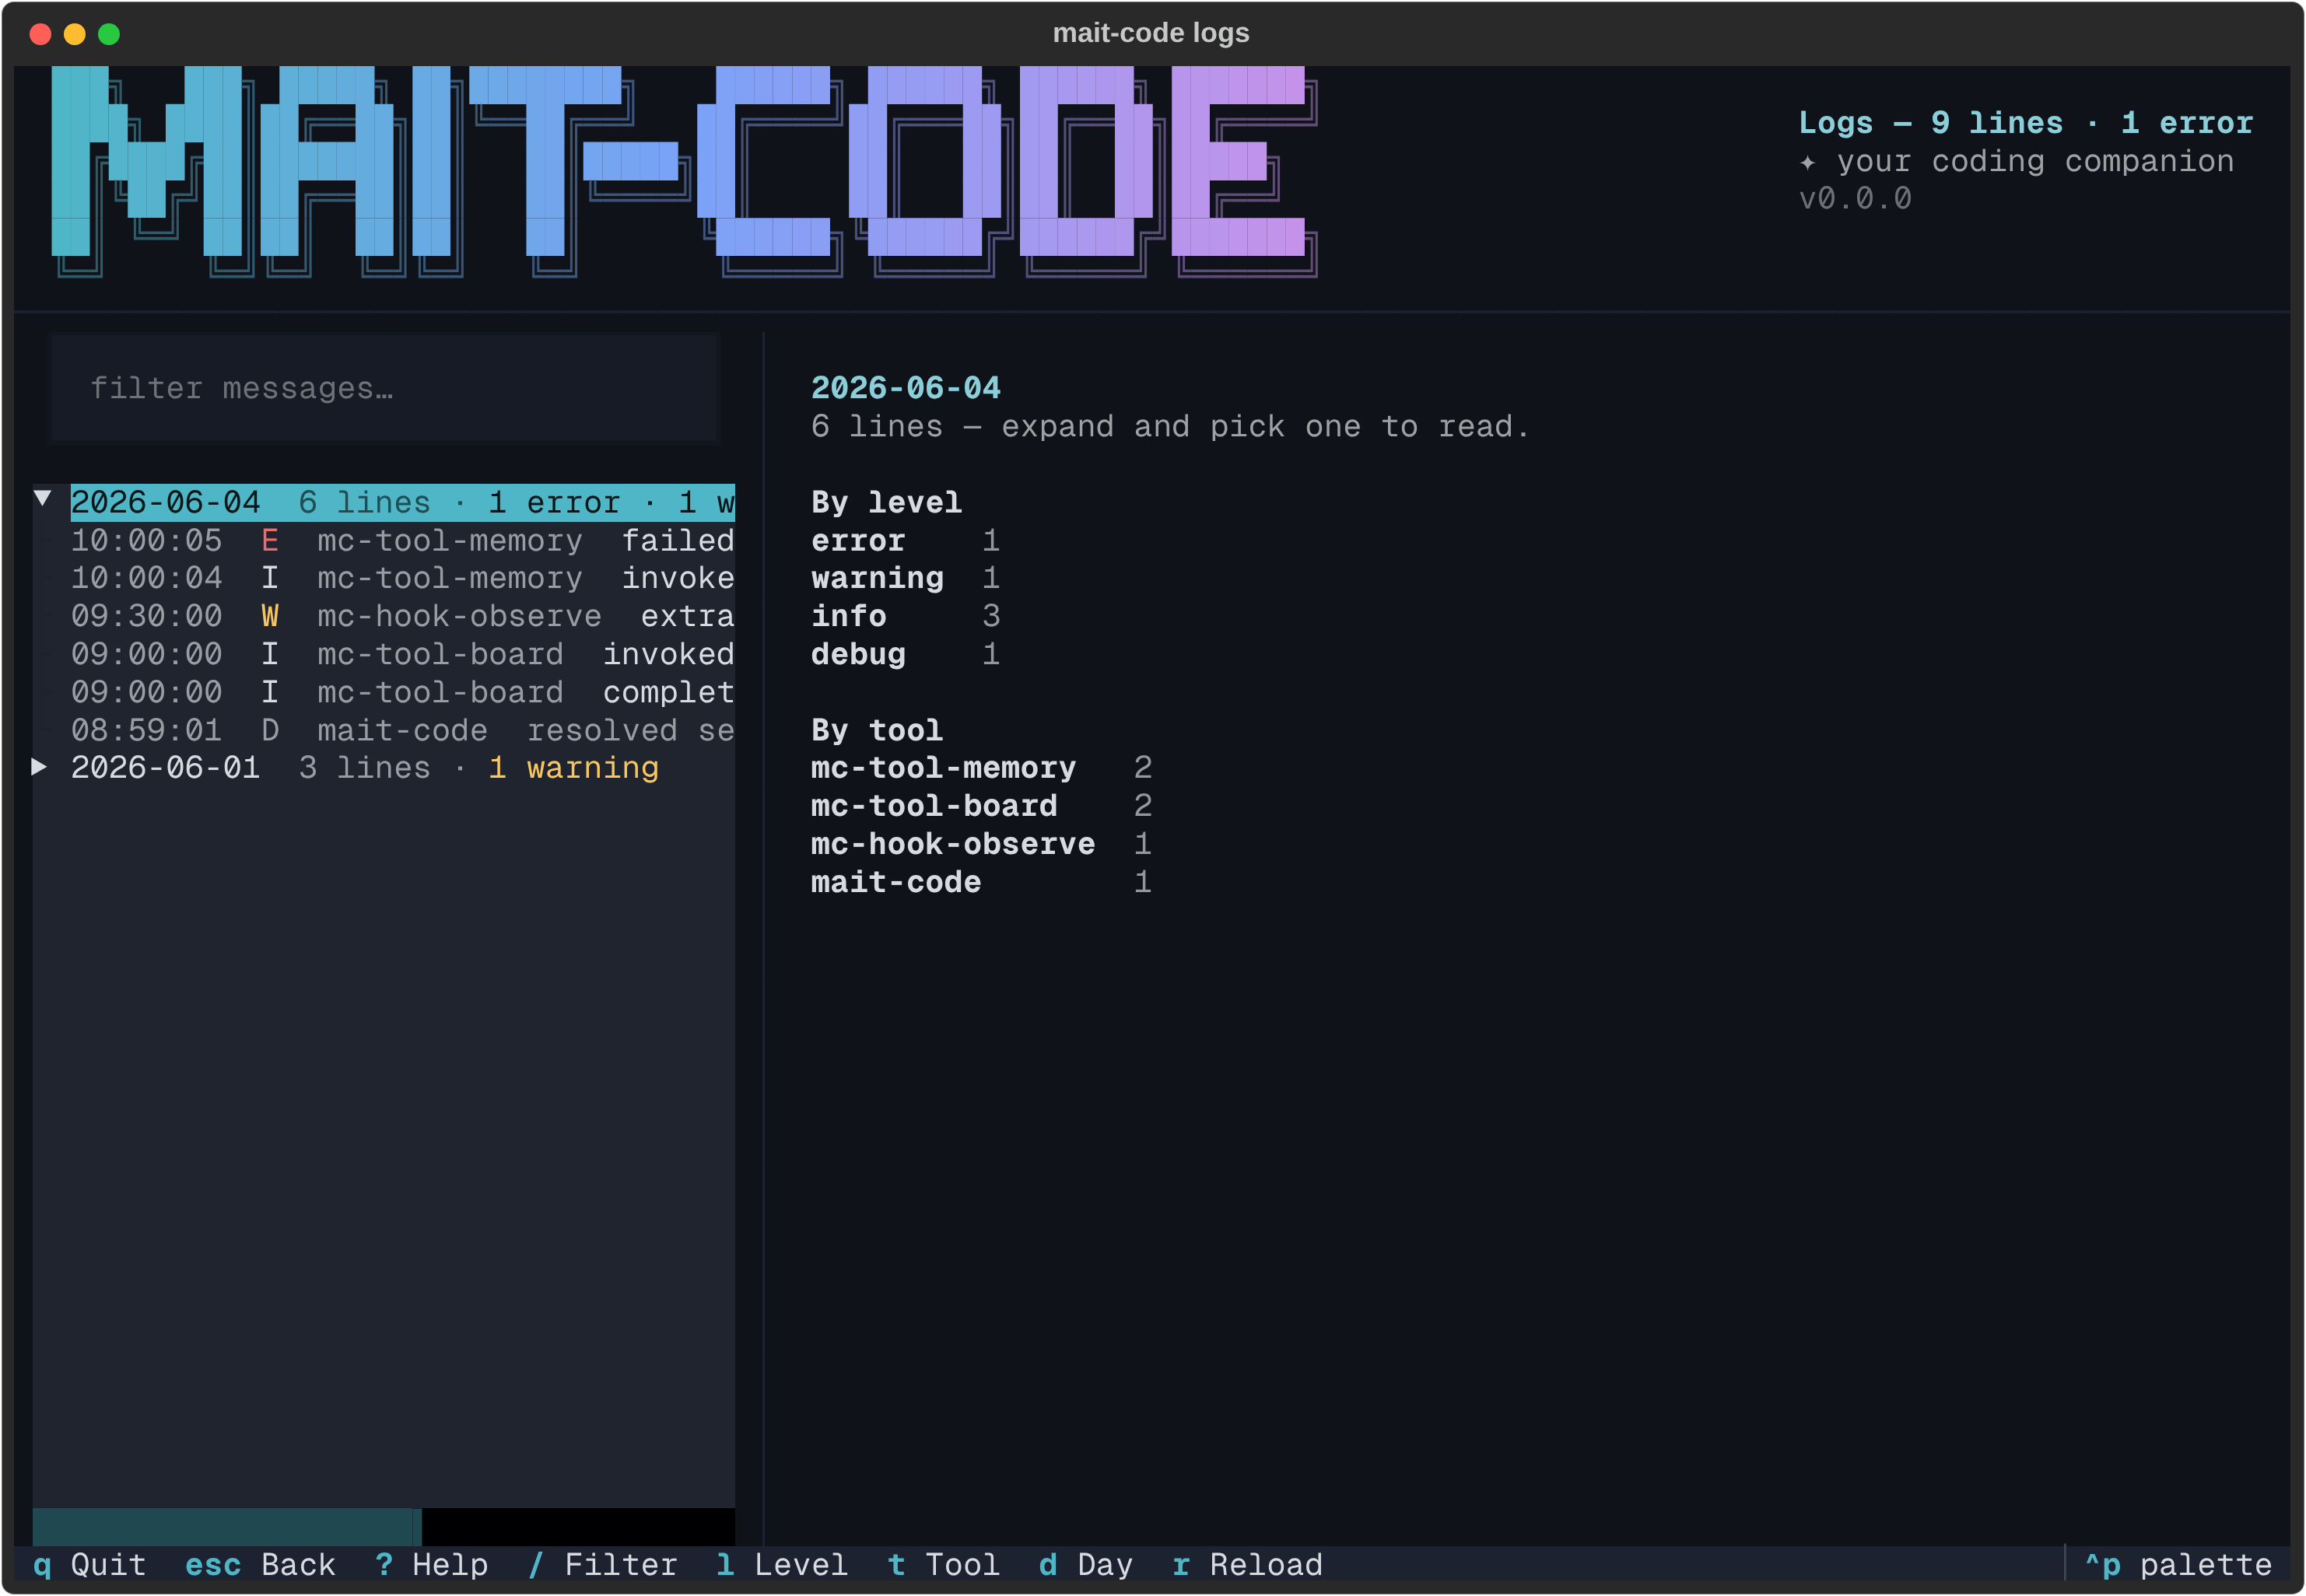
Highlight a day instead and the pane shows that day's shape: its lines per level and per tool — a quick "what was noisy yesterday" before drilling in.
Narrowing the view
Four filters compose, and the subtitle always carries the active set:
- Press
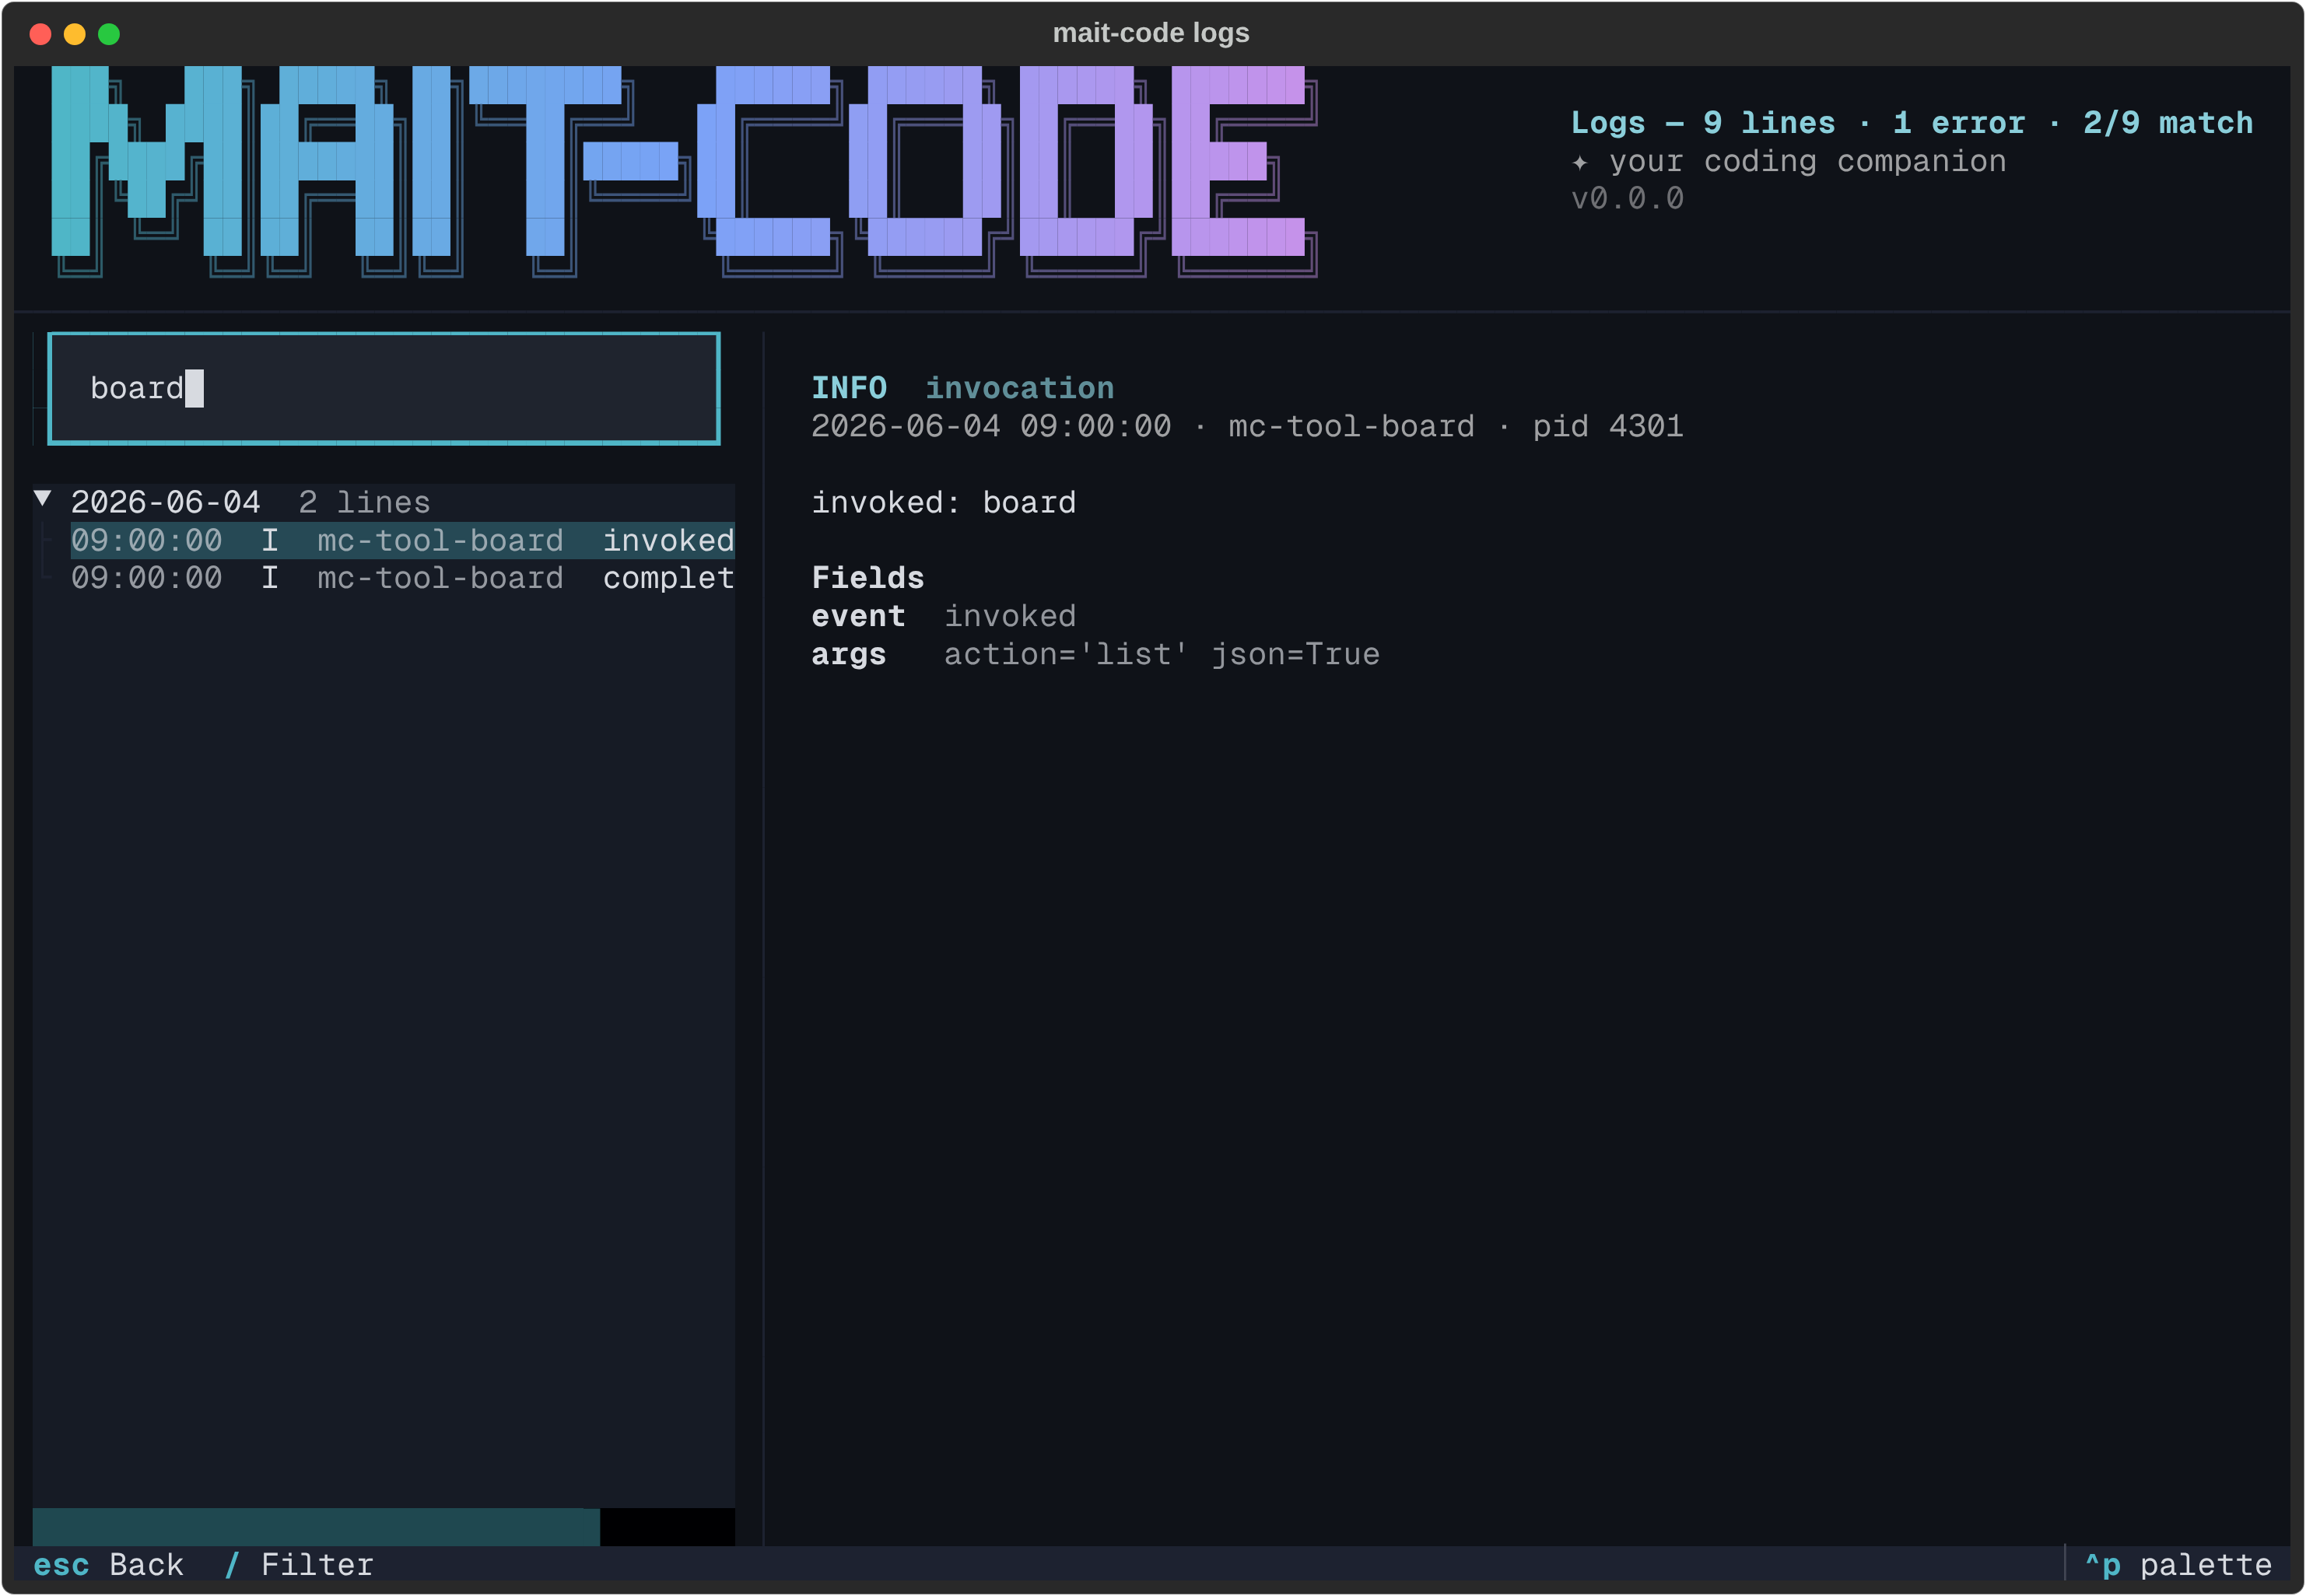
/to focus the text filter and type: the tree narrows live to lines whose message (or invocation arguments, or error message) matches, case-insensitively, every day expanding to show its hits. - Press
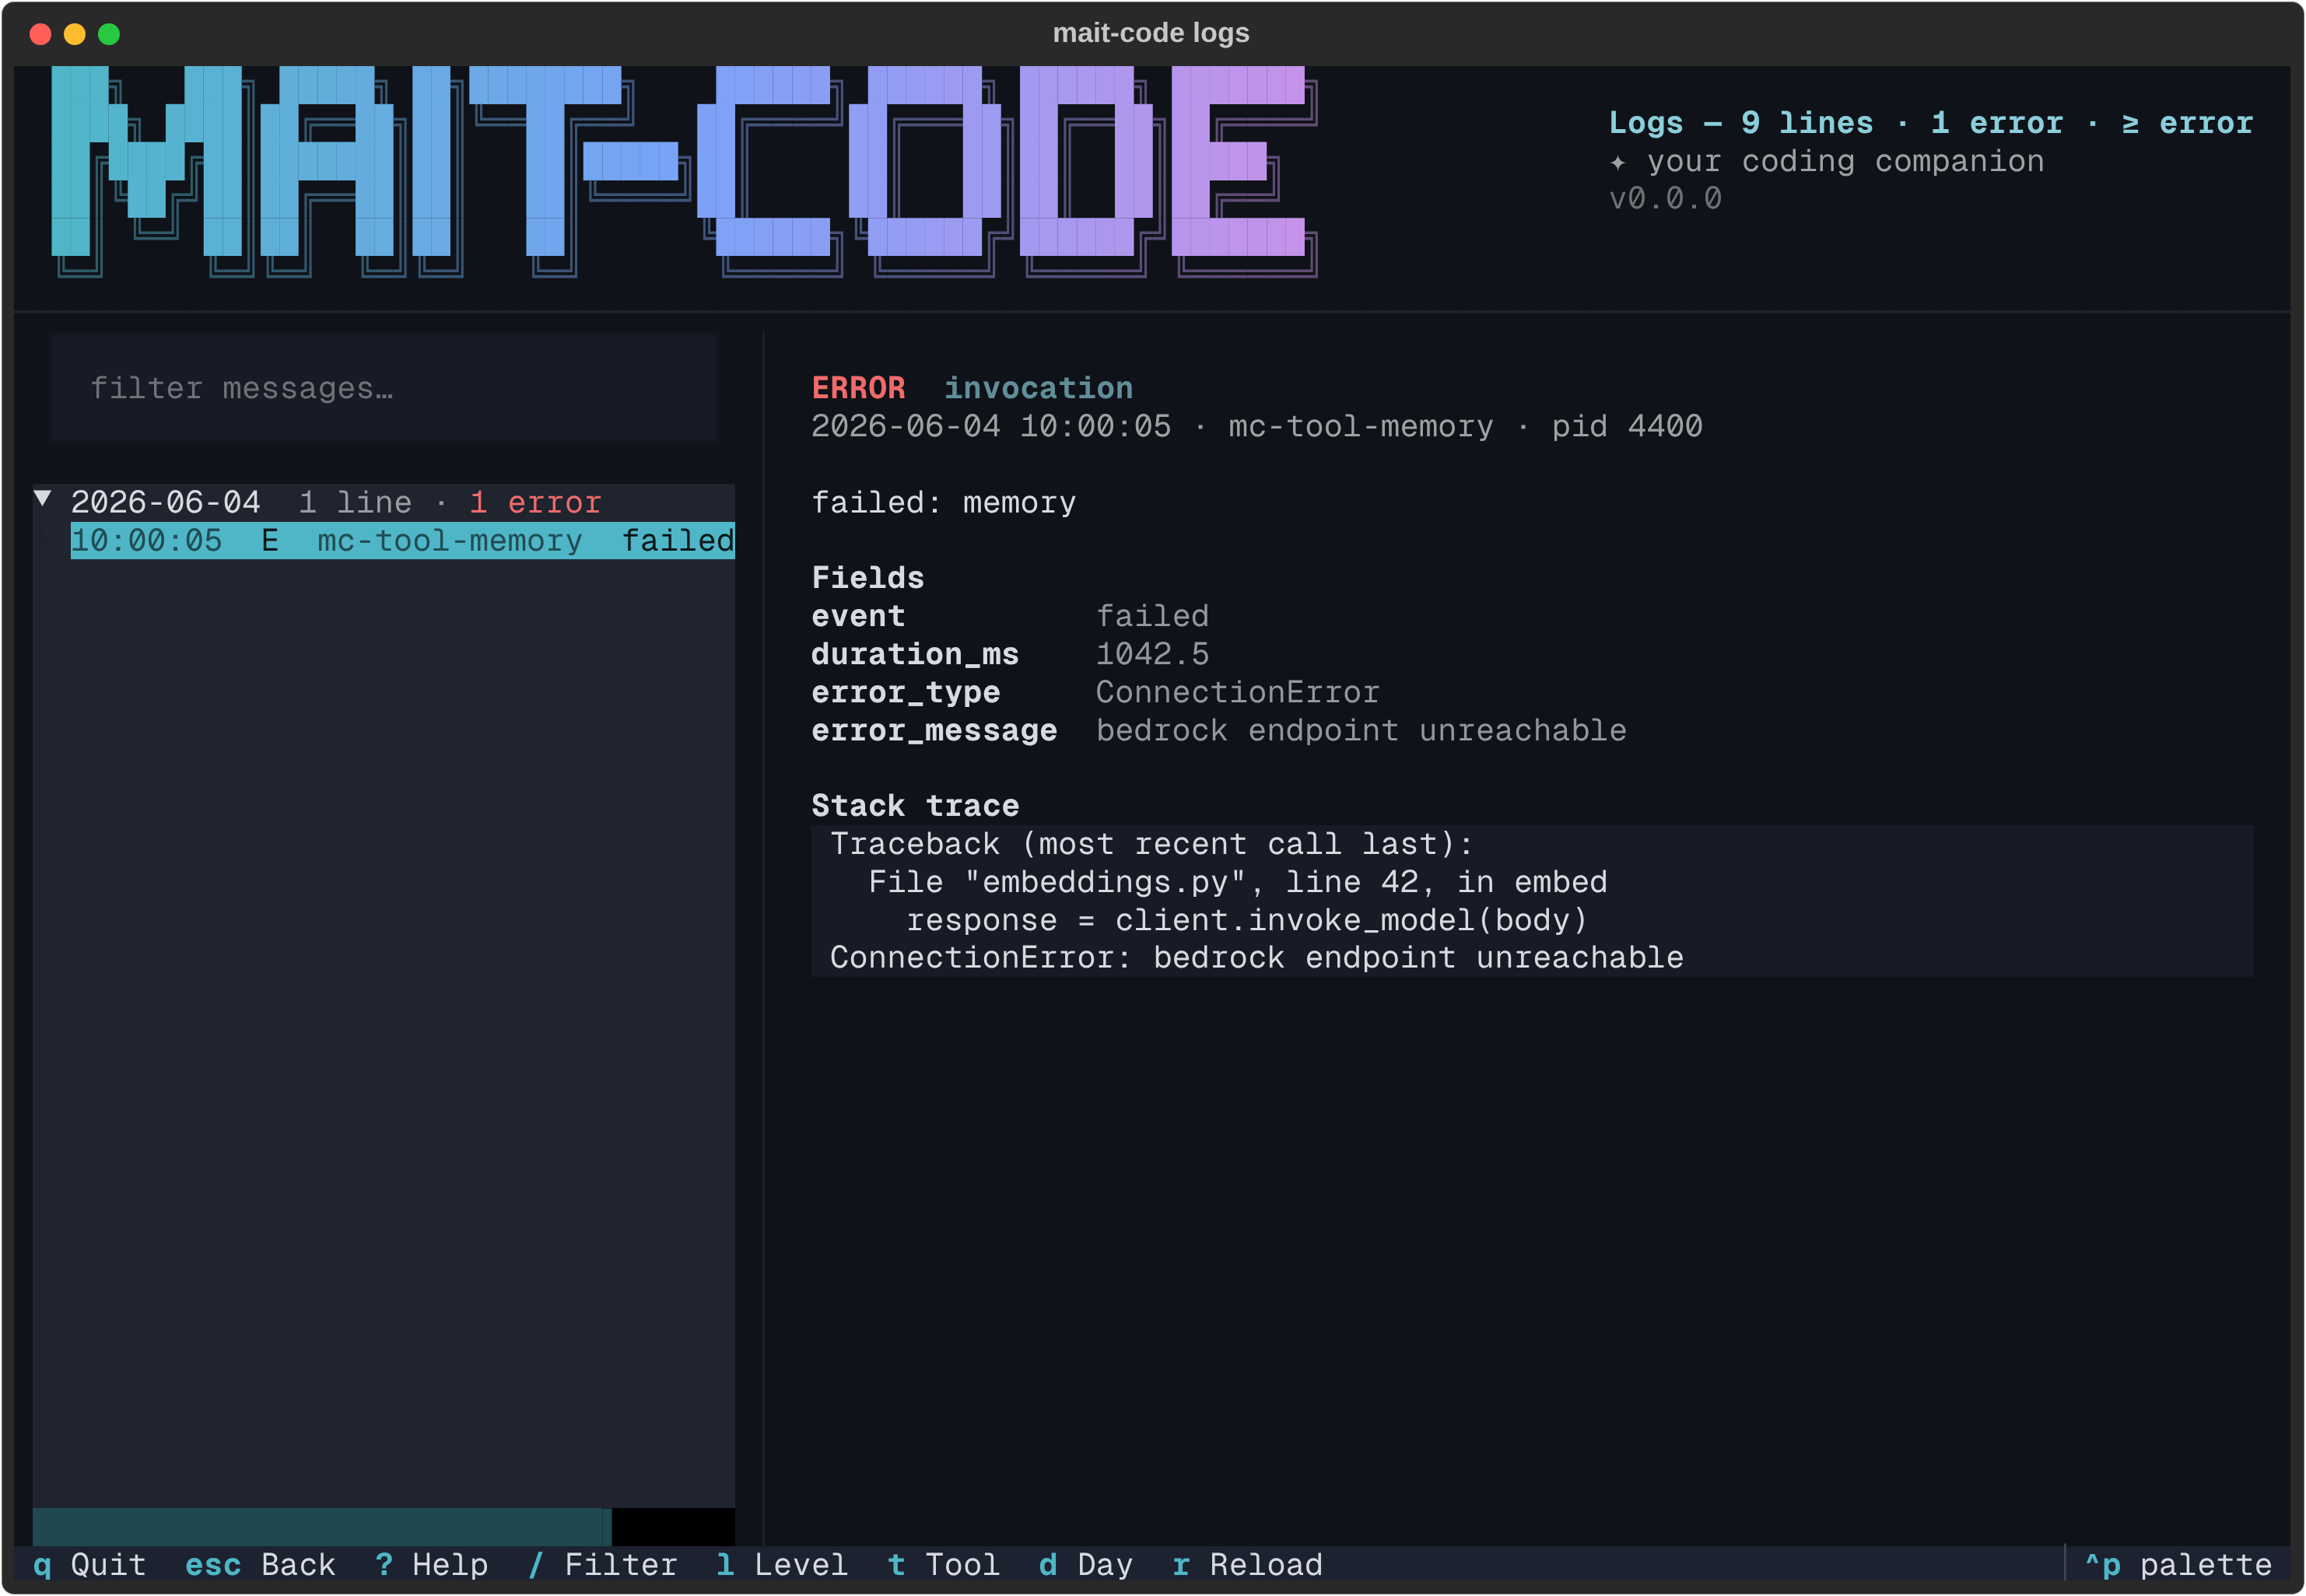
lto cycle the severity floor: all → debug → info → warning → error → all. The floor is a minimum —≥ warningshows warnings and errors. - Press
tfor the tool filter — a dropdown of every tool that appears in the loaded logs (mc-tool-board,mc-hook-observe, …). - Press
dto narrow to a day — the same dropdown over the days on disk.
Press r to reload — the viewer reads the files once at launch, and the
current session may well have appended lines since.
Off the terminal
Like the other TUIs, mait-code logs only opens the viewer on a TTY. Piped or
redirected, it prints a day-grouped summary instead — the line and error
tallies, then each day's counts with its first few error messages.
Reference
Keys
| Key | Action |
|---|---|
| ↑ / ↓ | Move the highlight; the detail pane follows |
| Enter / Space | Expand or collapse a day |
| / | Focus the text filter |
| l | Cycle the severity floor |
| t | Filter by tool |
| d | Narrow to a day |
| Esc | Back to the tree (from the filter/detail); quit (from the tree) |
| r | Re-read the log files |
| ? | Key cheat-sheet |
| Ctrl+P | Command palette (incl. theme switching) |
| q | Quit |
See also
- Logging (API reference) — the JSON Lines schema, the
MAIT_CODE_LOG_LEVEL/MAIT_CODE_LOG_FILEknobs, and where the files live. - The home hub — the System ▸ Open logs leaf that previews today's tallies and launches this viewer.