The observations browser
mait-code observations is a full-screen, read-only window onto the raw
extraction tier — everything the observe hook has pulled out of your sessions
that reflection hasn't yet synthesised. Where How memory works
explains the tiers and the memory browser shows the store
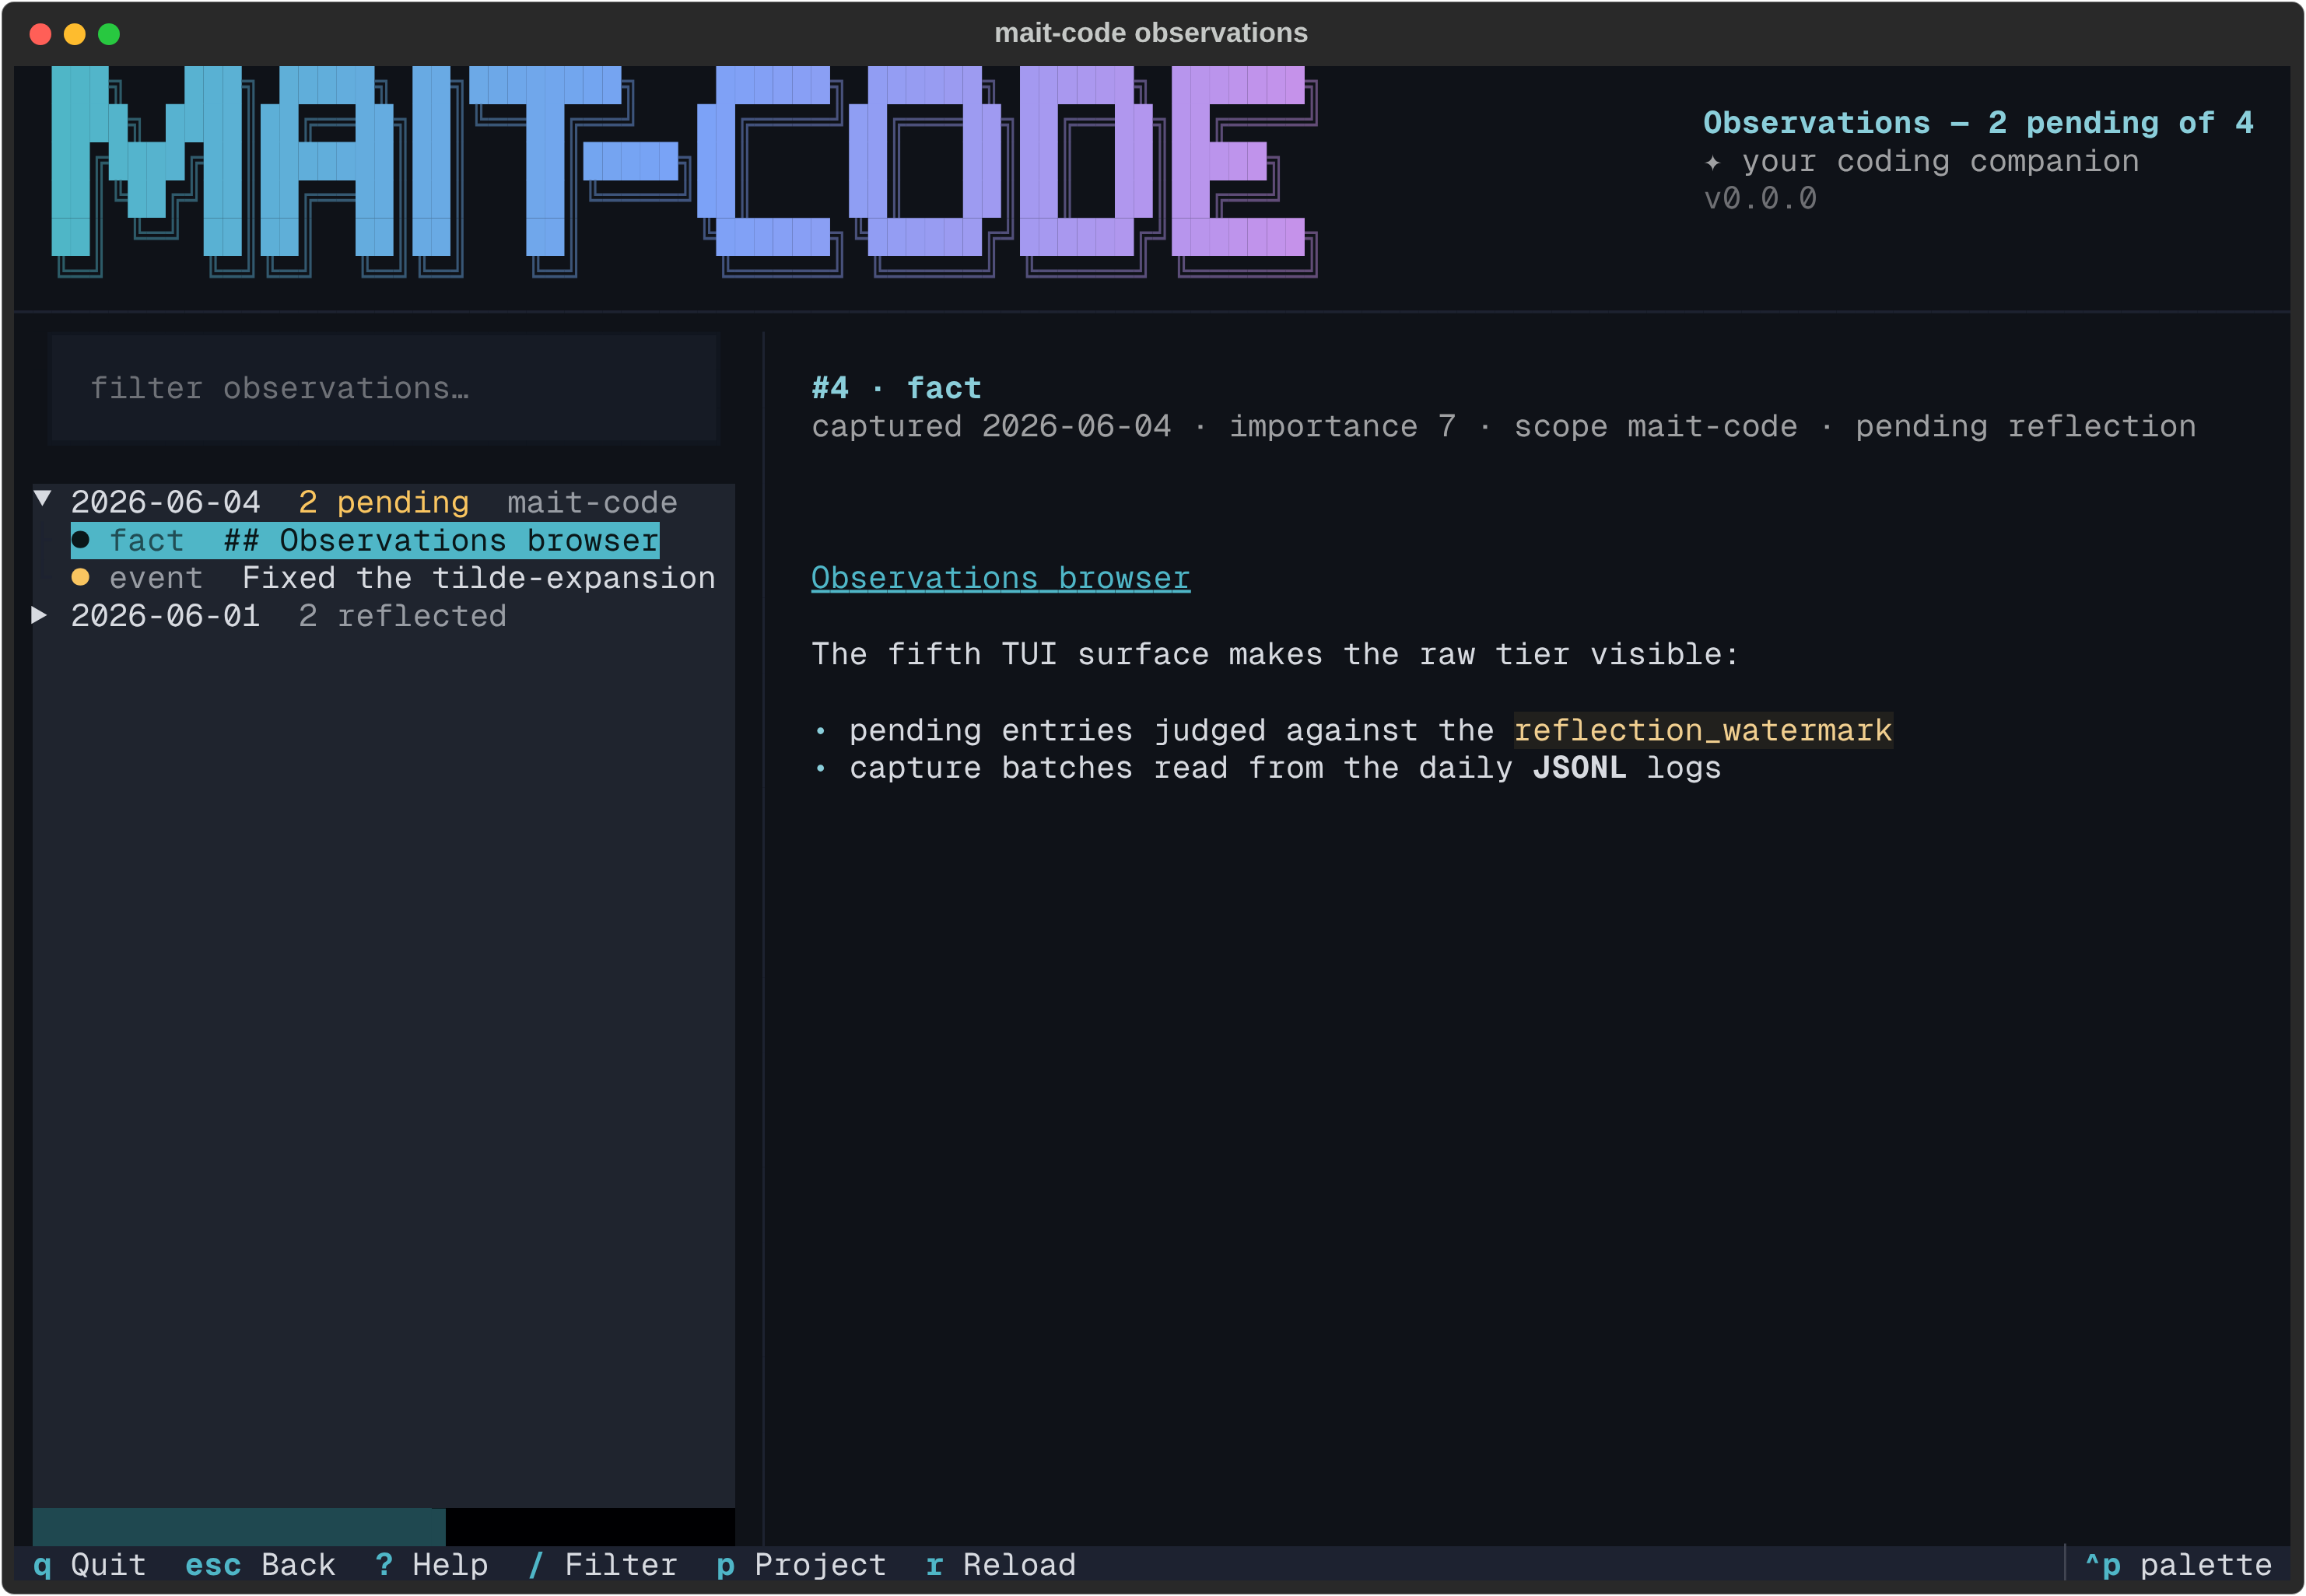
as a whole, this is the place you audit the backlog: a tree of observations
grouped by capture day on the left, each one flagged pending or
reflected, the selected one rendered in full on the right.
Why it exists
The observe hook works silently: at compaction and session end it extracts
facts, preferences, decisions and events into memory.db, and /reflect later
distils them into insights. Between those two moments the raw tier used to be
invisible — the home hub could say "awaiting 15 observations" but nothing
could show you what those 15 things were. This browser is that missing
drill-down: see what was captured, when, from which project, and what the next
reflection will actually chew on.
It is deliberately read-only, like the memory browser. It never reflects,
edits or deletes — synthesis stays with the /reflect skill, writing stays
with the hook. The pending/reflected split is judged against the reflection
watermark (the high-water mark /reflect advances), so what you see pending
here is precisely what the next reflection run will consider.
The layout
Three regions, top to bottom:
- The masthead — the shared brand banner, labelled Observations, with the
backlog folded into its subtitle (
Observations — 12 pending of 87, plus the project scope and match count while filtering). - The body — a filter box over a tree on the left, the detail pane (the wider share) on the right.
- The footer — the live key hints.
The tree groups observations by capture day, newest first. A day with
anything pending opens expanded and carries a N pending badge in the warning
colour; a fully-reflected day stays collapsed behind a dimmed count. Each leaf
reads <marker> <type> <first line>: ● for pending, ✓ (dimmed) for
reflected.
Reading an observation
Highlight a leaf and the detail pane renders it:
- a title —
#<id> · <type>, - a metadata line —
captured <date> · importance <1–10> · scope <scope> ·
  <pending reflection | reflected>
, - and the body, rendered as markdown (plain text is just a subset).
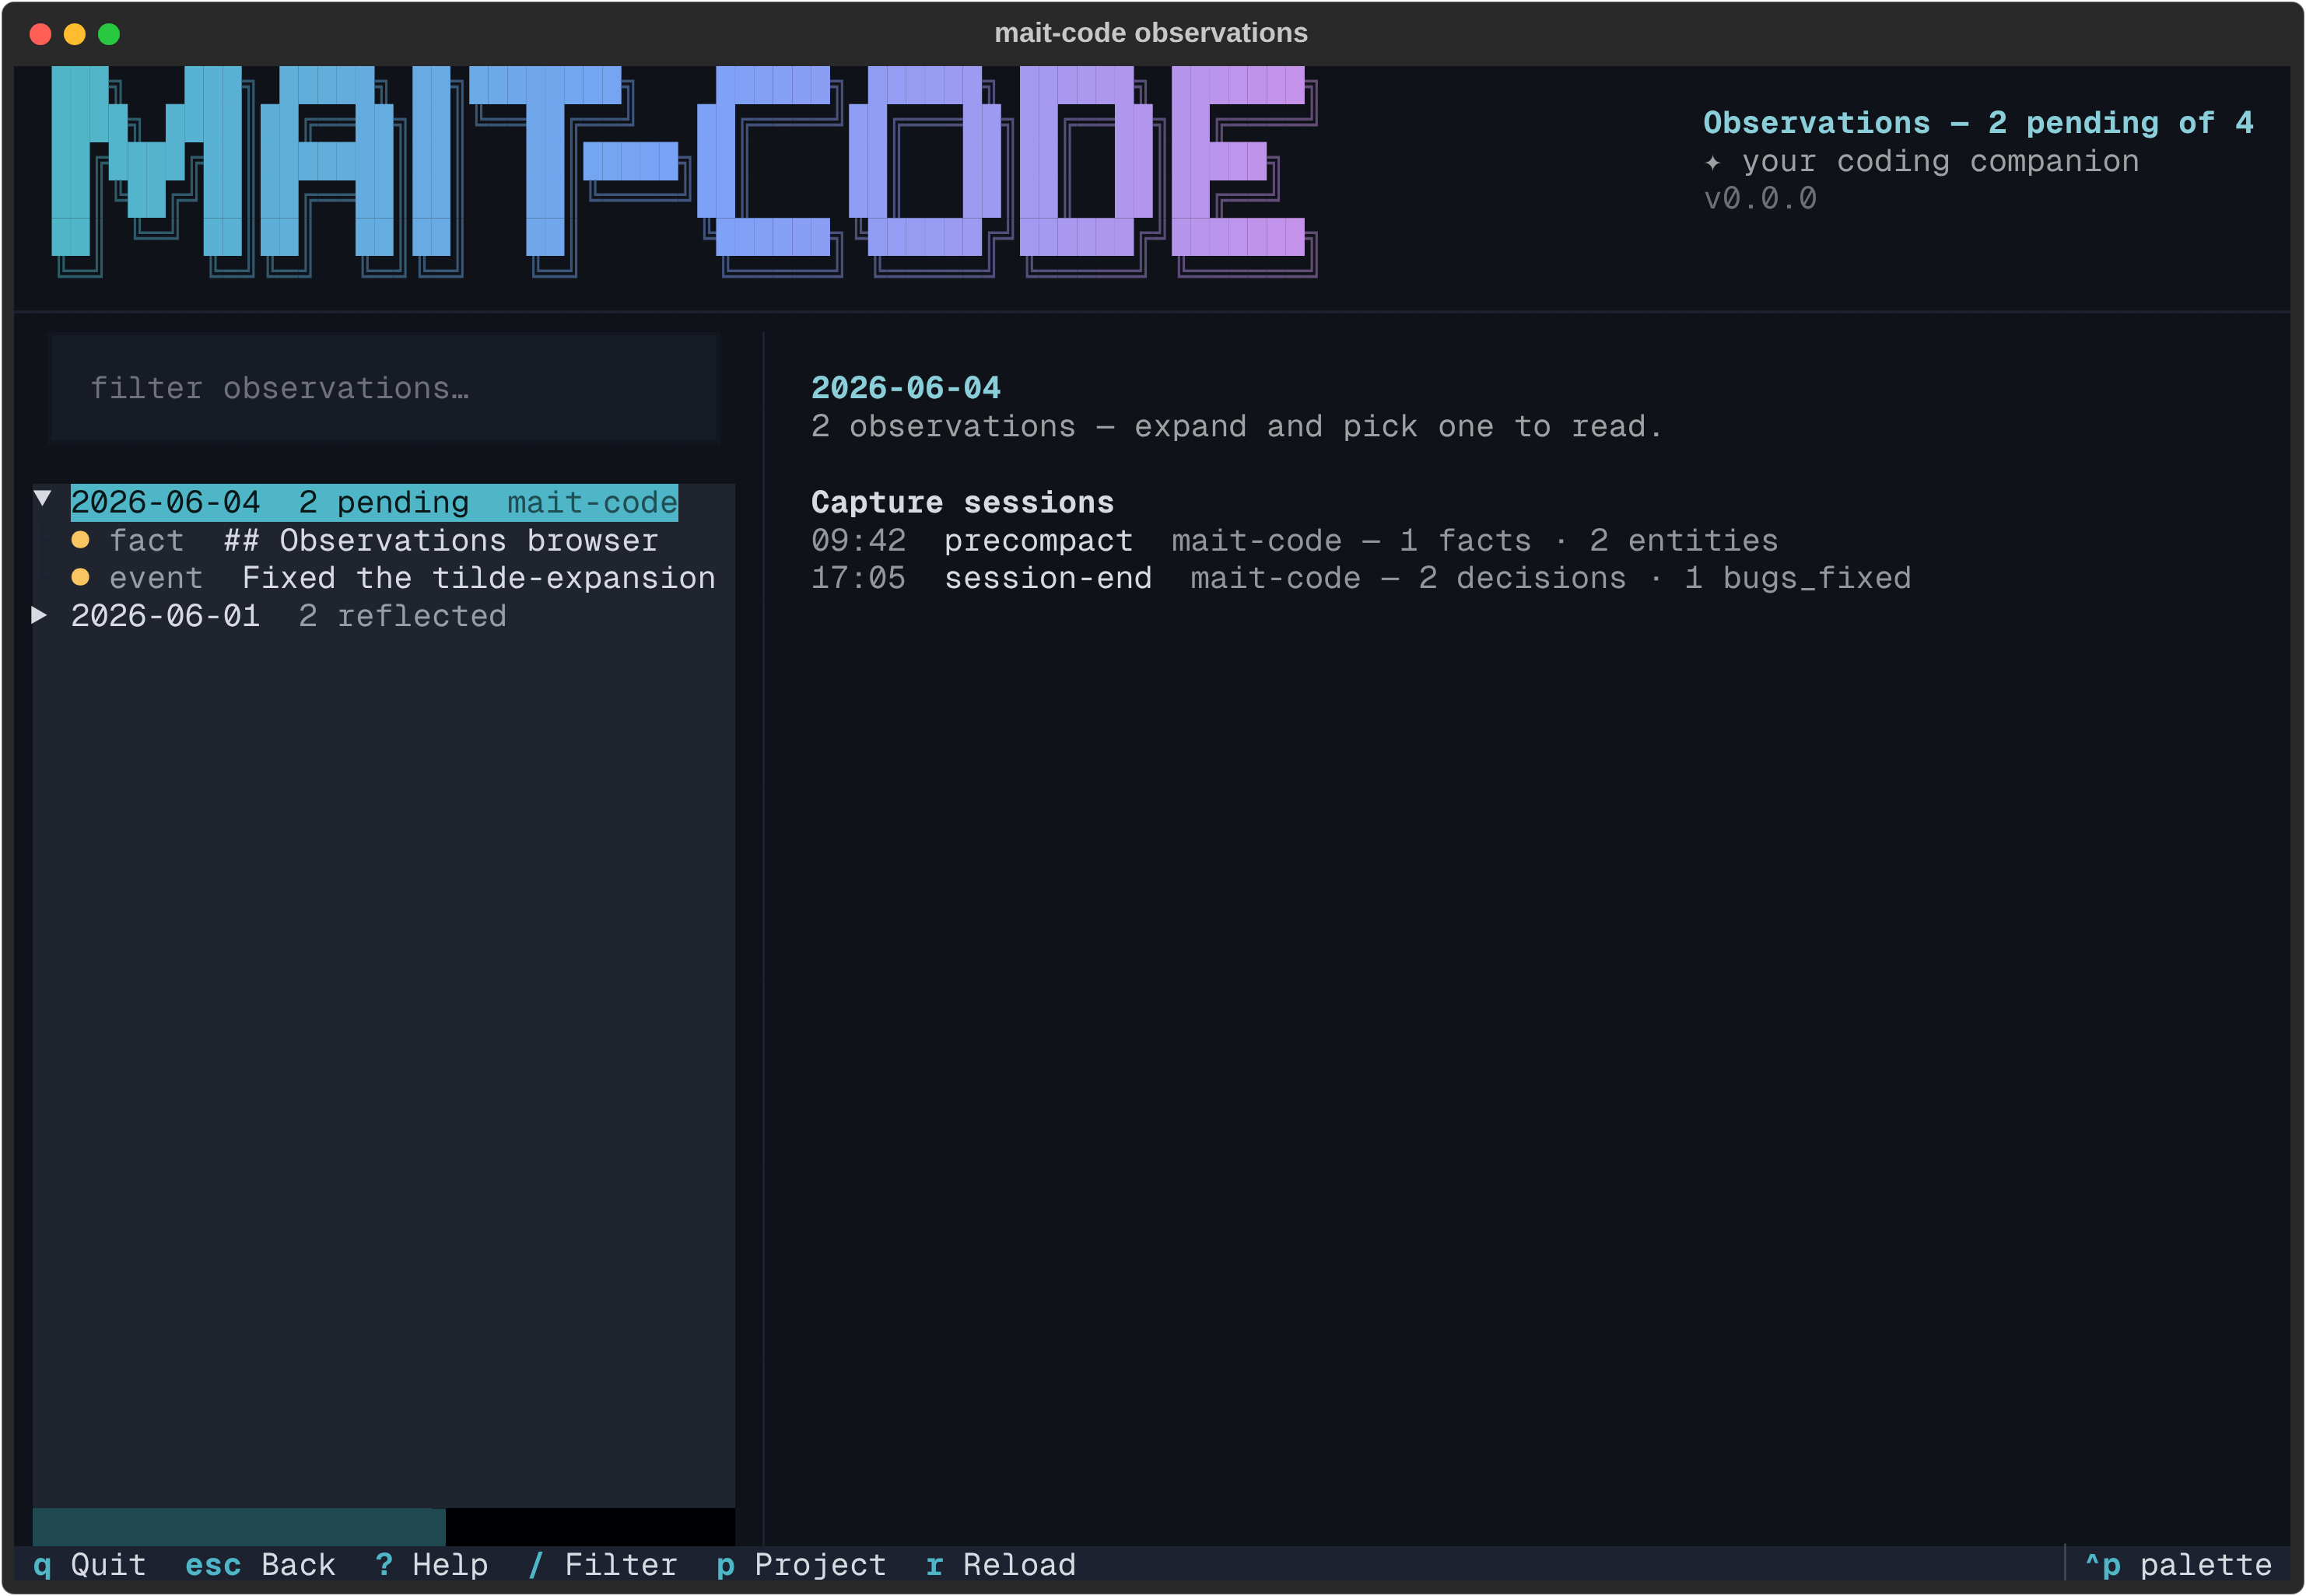
Highlight a day instead and the pane shows that day's capture sessions,
read from the daily JSONL logs the hook also writes: when each capture ran,
what triggered it (precompact, session-end), which project it came from,
and how much it extracted per category. The database stays the source of truth
— the logs only contribute this per-capture metadata, and a day without a log
simply says so.
Narrowing the view
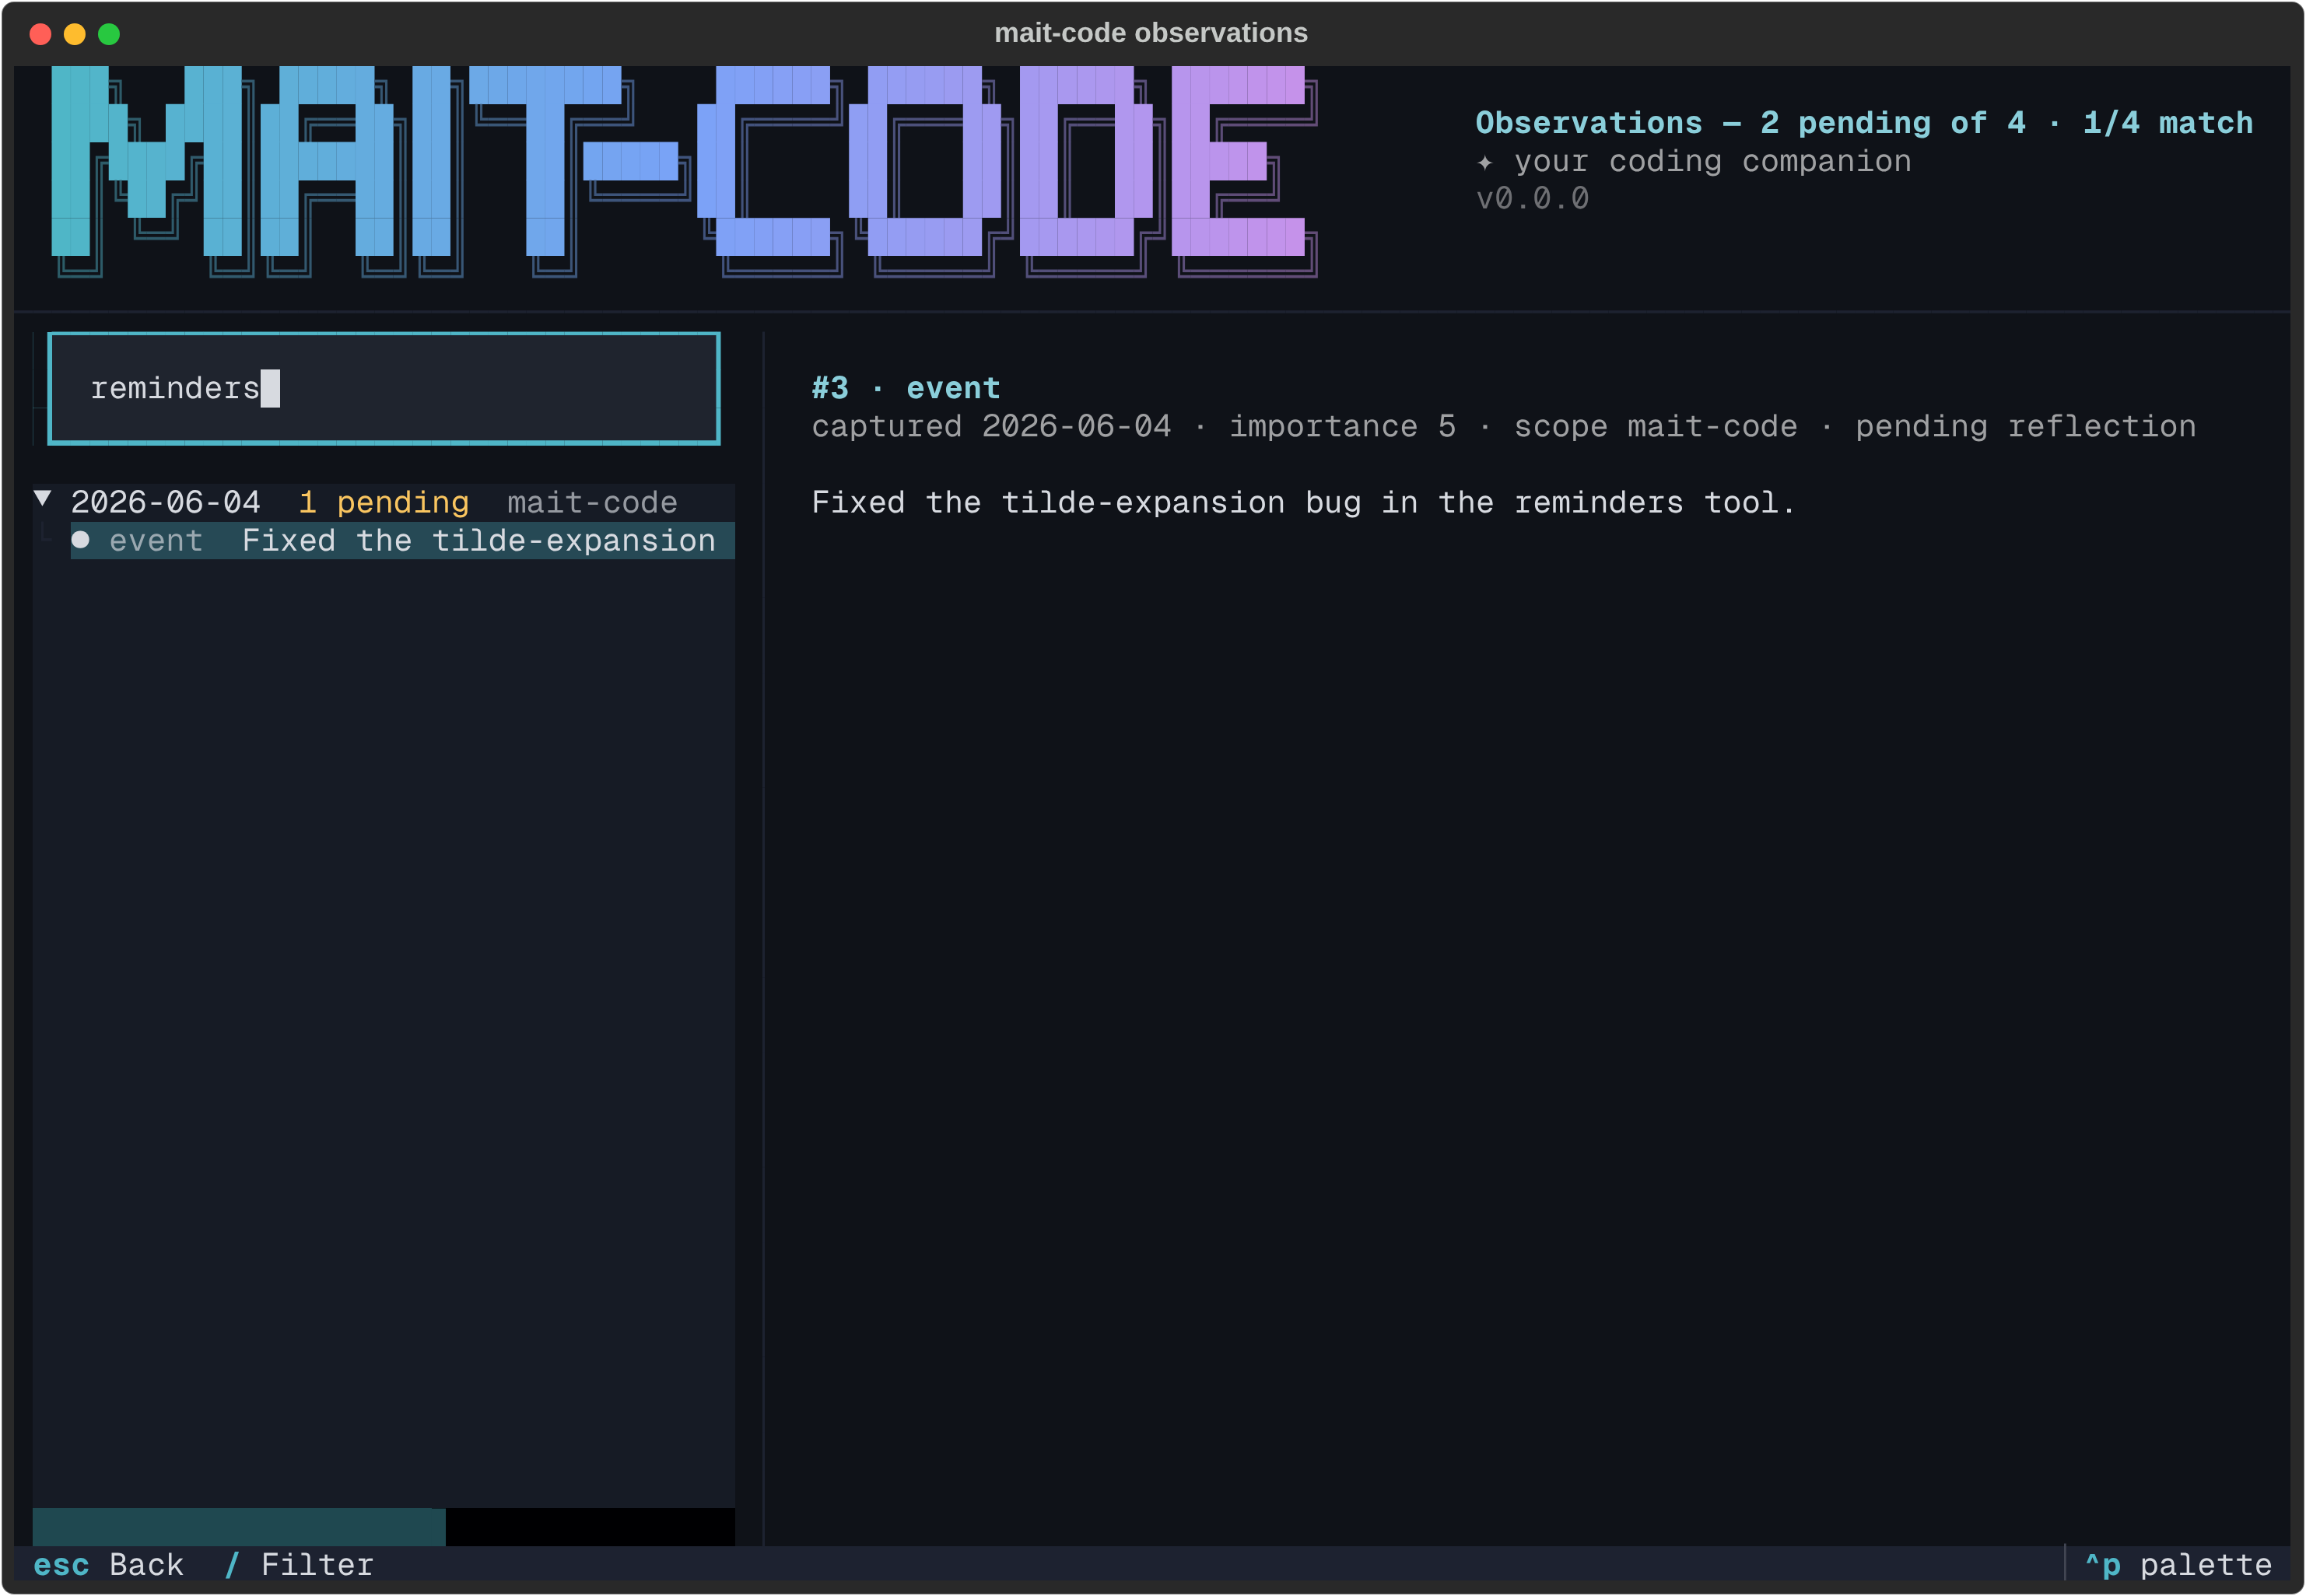
Press / to focus the filter and type: the tree narrows live to observations
whose content matches (case-insensitive substring), every day expanding to show
its hits.
Press p for the project filter — a dropdown of every project that has
observations, exactly like the board's. Picking one narrows the tree to that
project (plus global observations) and, importantly, judges pending/reflected
against that project's own watermark, since reflection runs per-project.
Off the terminal
Like the other TUIs, mait-code observations only opens the browser on a TTY.
Piped or redirected, it prints a day-grouped read-only summary instead — the
pending tally first, then each day's entries with their markers.
Reference
Keys
| Key | Action |
|---|---|
| ↑ / ↓ | Move the highlight; the detail pane follows |
| Enter / Space | Expand or collapse a day |
| / | Focus the filter |
| p | Filter by project |
| Esc | Back to the tree (from the filter/detail); quit (from the tree) |
| r | Re-read the store |
| ? | Key cheat-sheet |
| Ctrl+P | Command palette (incl. theme switching) |
| q | Quit |
See also
- How memory works — the tiers, extraction and reflection behind what you're auditing.
- The memory browser — the whole store, including what reflection has already produced.
- The review queue — working through the curated memories that have aged out.
mc-tool-memory—reflectand friends (the synthesis this browser deliberately doesn't trigger).